
In yesterday’s post, we analyzed 3 pairs that could be headed to take a hit: USD/CHF, EUR/GBP, EUR/JPY. However, both EUR/GBP and EUR/JPY dried up on volumes, and they didn’t reach the target levels. The confirmation as a break of a low volume bar / SR level is especially important when the background is neutral/adverse.
In USD/CHF, we were looking for a possible LONG position reaching the trendline/support at 0.969.
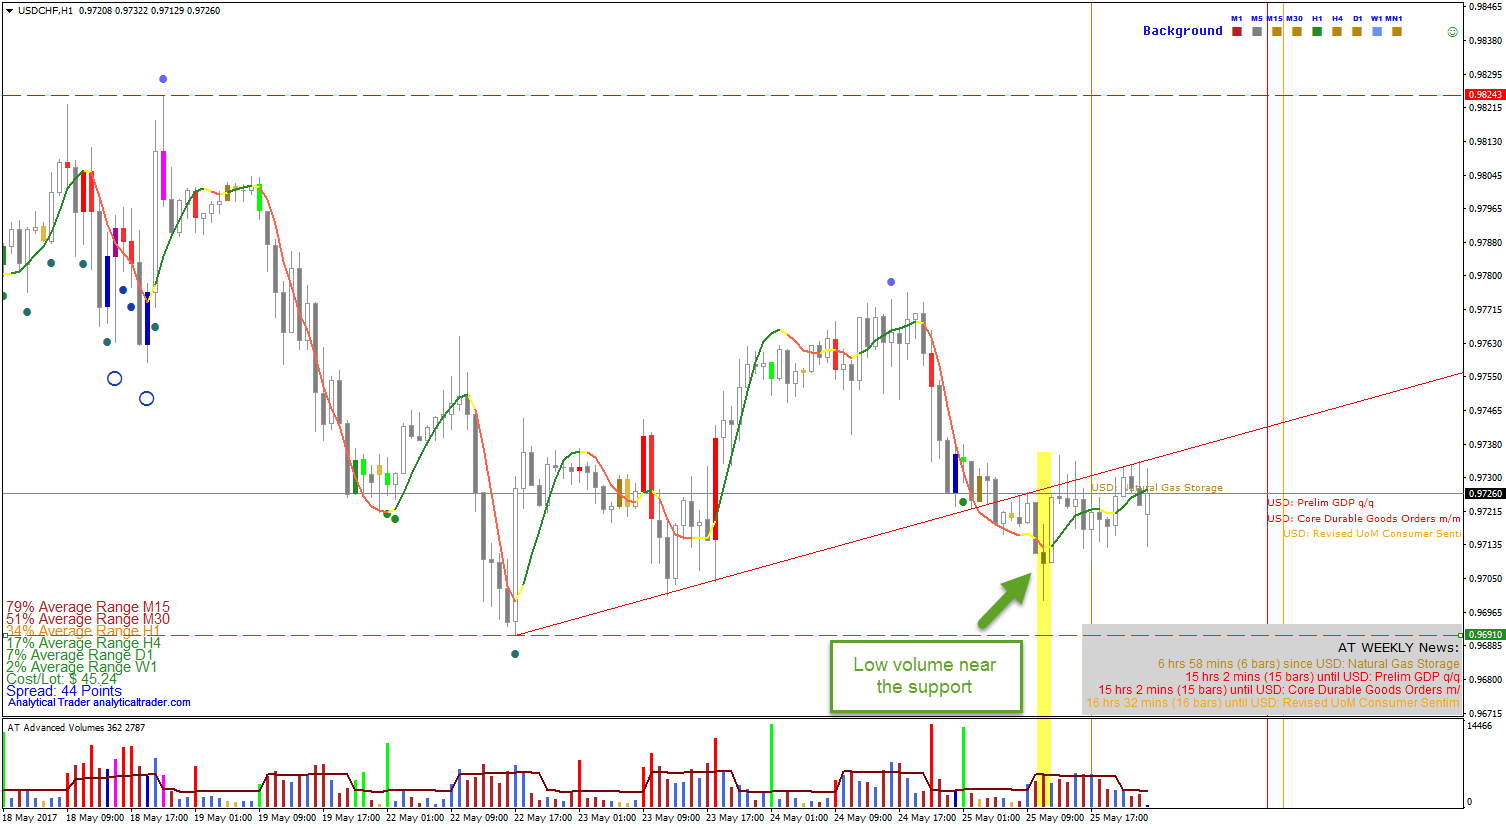
In the chart we can see that there were low volumes near the support, giving a confirmation for a LONG trade during the London session. And why? This is because there is plenty of buying at this level, so any low volume bar is showing lack of supply in a critical zone.
As the New York trading session closes, we found 3 potential trading opportunities to follow and possibly trade during the Tokyo session or tomorrow’s London. These opportunities are in USD/CHF, EUR/GBP, and EUR/JPY. Below you can check the current market background, short-term trend and nearest supports/resistances for each pair. As always, we are using VSA, and associated indicators, for a supply/demand view of the market.
Read the 25/May Update here: https://www.analyticaltrader.com/market-update-final-remark-on-ny-closing-session/
USD/CHF M30
Background: Weak
Short-term trend: Down
Support: 0.9691
Resistance: 0.98243

This is a pair to observe in case it rebounds after touching the upwards trendline. The market is currently in a downward sloping trend with low volume, showing a lack of supply to further continue the trend. If the trend rebounds and breaks the previous bar high near the 0.9705 level on high volume, we may be heading for a rally in the late Tokyo/early London session. Traders should look for low volume near the trendline and a fast price movement as prices break the already mentioned level.
EUR/GBP M30
Background: Neutral
Short-term trend: Down
Resistance: 0.86743

In this case, we see a short-term uptrend that seems now to be starting a reversion. There were already many weak VSA signals in the current and above timeframes and the trend is now down. If it breaks the most recent trendline, may look for a SHORT position on high volume showing strong supply. This may constitute a good trading opportunity to open a short position since there is no strong support nearby.
EUR/JPY M30
Background: Neutral
Short-term trend: Down
Resistance: 125.288
Support: 124.552

EUR/JPY may be a good trading opportunity even before the opening of the Tokyo Session. The trend failed to break the near resistance and bounced back. We’re now at a crucial zone where the market has been trading sideways. If prices continue the downward trend, there may be room for a SHORT position with a take-profit near the mid-term support. There has been distribution recently and the high volume bar denotes supply near the resistance
The NFP is due in some hours, and we found 3 potential trading opportunities before and after the release, in NZD/USD, GBP/USD and USD/JPY. Below you can check the current market background, short-term trend and nearest supports/resistances for each pair. As always, we are using VSA, and associated indicators, for a supply/demand view of the market.
NZD/USD M15
Background: Strong
Short-term trend: Down
Support: 0.68500

NZD/USD may be a solid trading opportunity for a late Tokyo Session or early London. We’re approaching a major news announcement and, if NZD/USD retraces after the announcement, it may be a good buying opportunity near the long-term support at 0.68500. If prices touch the resistance and bounce back, traders may open a long position, which will be reinforced in case there are demand signals. Low volume bars during a downtrend near a resistance may also anticipate a trend reversion.
GBP/USD 1H
Background: Weak
Short-term trend: Neutral
Resistance: 1.29648
Support: 1.28631

In this case, we see a long-term downtrend and prices near the upper bound. After the news, in the case of GBP/USD appreciates and touches the trendline, it may be a good opportunity to short. This is because there was distribution before, and if NFP doesn’t change things radically, it could give a shot to trade GBP/USD.
USD/JPY 1H
Background: Strong
Short-term trend: Up

There are no supports, neither resistances nearby. However, we saw an uptrend that was broken with high volumes during the US session. News about US employment are due in a few hours and it will bring some volatility. In case prices approach the trend line from below, it may become a short opportunity. Look for low volume bars approaching the trendline.
The NFP will dictate what happens next, but by being alert to what’s happening now, we can better plan our trades.
In today’s Tokyo’s session I found 2 potential opportunities for the next session, on 2 of the major pairs: GBP/USD, and USD/JPY.
GBP/USD 30 MINUTES
Background: Weak
Short-term Trend: Down
Support: 1.2767
Resistance: 1.2904

GBPUSD 30 Minutes
- At this point, we can see distribution (many supply signals on sideways movement)
- Based on this weakness behind, wait for a short BREAKOUT alert from Alert System.
The next news important news (Retail Sales m/m) is in roughly 8 hours, so, be sure to look for a breakout afterward. Depending on the news result, there could be a reversal near the 1.27 support – let’s wait and see what VSA shows at that area.
USD/JPY 1 HOUR
Background: Neutral
Short-term Trend: Down
Support: 109.213

USD/JPY Hourly
- Prices broke out the 109.213 resistance with high volume in today’s US session. There is latent supply shown by VSA supply signals
Although there was a breakout, the background is still neutral due to the recent supply signals. Still, if no more supply shows at these prices, I am still bullish, and looking for a long position, on a low volume down bar, above 109.213. The Alert System is also likely to alert if prices get nearer.
Dynamic trend: Turned up
Background: W1 – very weak; D1 – weak
Phase: Markup
Support: 1.066
Resistance: 1.079

EURUSD: Hourly
Considerations
Point 1: We can observe “Shakeout” with very large volume and a wide range, on a weak congestion zone. This movement alone indicates absorption of supply, but the subsequent down-bar indicates that the supply is still high, and the market is not ready to grow.
Point 2: “Test” with a low volume and an average range. Follow up-bar indicates the success of the maneuver.
Point 3: There was a breakout of the congestion zone with a high volume and wide range. In TF M15, a successful test occurred and then continued to grow.
Suggested Strategies
Strategy 1: Consider buying if:
- The price breaks out the resistance level 1.079 and
- «No supply» occurs.
Strategy 2: Consider to buy if:
- The price pulls back to the support level 1.066;
- «No Supply» appears (down-bar with a narrow range and a low volume);
- And the price reverses up.
Strategy 3: Consider going to sell if:
- The price breaks down the support level 1.066 and;
- «No Demand» appears (up-bar with a narrow range and a low volume).
Tips
You can search «No Demand» and «No Supply» on a lower TF.
Know more about CONGESTION ZONES
Dynamic trend: Turned up
Background: W1 – weak; D1 – strong
Phase: Markup
Support: 113.60
Resistance: 116.00

USDJPY: Hourly
Observations
Point 1: There was a breakout of the resistance level, with an average range and a high volume. The following up-bar confirmed buying. In addition, on a smaller TF, we can observe a successful testing after this breakout, which confirmed the validity of this movement.
Point 2: We may see a “Shakeout” with a wide range and very high volume. Because the subsequent bar was a down bar, and the volume was high, we may conclude there is a large supply in the market, which must be tested.
Point 3: A second breakout of the resistance level (113.60) occurs.
Suggested Strategies
- Consider buying if “No Supply” appears (down bar with a narrow range and a low volume) near the support level 113.60.
- Consider selling if the price breaks down the support level 113.60 and “No Demand” appears (up bar with a narrow range and a low volume).

