

GBPUSD is trading near a support formed at 19th May, and is also near an up trendline coming back from 20th April. After the Pound bull market being stopped by professional selling around 1.578 (purple signals), and consequently going into a correction, more recently it has seen buying at this level. This may mean this is actually re-accumulation, and so the bull market may be sustained. The background reflects this and it shows up as strong.
If prices stabilize in a few more bars (i.e. they don’t make lower lows), and make a higher high, there is a potential long entry in a down bar. Meanwhile it’s important to notice that there is another validated trendline, to the downside. So if prices break the support, and the background keeps being strong or neutral, I’ll look for a strong signal near the lower part of the channel.


The background is weak and there was a recent weak signal. But when prices got near the dynamic trend changing point, it was already green again; prices then spiked up, which goes to show the danger of not following the rules. Now in GU it’d be interesting to see another weak signal to see if there is another dynamic trend setup, or if prices come down to 1.5155 they’ll be near a trendline, that with the right background, can give a potential trading setup.

At 17th April, there was a significant selling climax in the market, marked by a green signal with a corresponding red volume in the histogram, at values way above the average. Since then, there was an attempted rally, but the volumes didn’t pick up nowhere during the whole rally, showing lack of interest by professionals. Without demand, the market had to go down to test the previous area of demand, and/or continue the accumulation.
Right now, the market is testing for supply, which can be seen by the gray bar in the histogram, with the candle making lows on the lows formed by the selling climax. If the test is successful (= no supply), the market should rally in the next few bars, because the smart money will jump in such an indication of strength. If it’s not, it’ll stall or even break the support. This is yet to be decided, and there is another factor going on – the market is trending lower, making successive lower lows. So for a possible long I’ll wait for prices to at least rally and make a dip where that red rectangle is, confirming a successful test and a change in the trend. If however this support is to be broken, the prices aren’t too far off the lower part of the channel, where a future price reversal can take place.

Euro/Yen has an established trend channel, that is validated since 6th April. It’s now bouncing off the lower line and getting near the upper part of the channel, which makes it an interesting pair to watch right now.
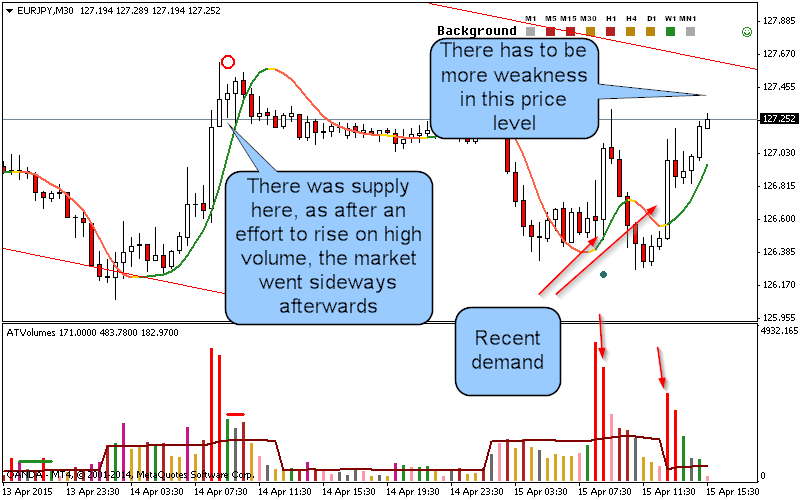
Looking at what’s happening right now, the pair has shown weakness before, at these prices, by the end of yesterday’s NY session. This is marked by the red circle above the up bars. There was an effort to take prices higher, which can be seen by the very high volume bars (red histograms) and with prices going up in a wide range. It could have been strong if it had broken the 127 83 level, which was the nearest resistance. But instead, prices went sideways and then corrected in today’s London session.
Today the market showed demand, marked by the blue dot and by up wide range bars with very high volume. The smart money sure is buying at this price level, the question is whether it’s going to be enough to turn the trend (i.e. breaking the down trendline). The background is still marking it as weak since the market is still in a downtrend, and there needs to be a trendline break to confirm a trend change. More weakness at this price level would be very bearish though, and if on sufficient high volume, it would nullify the recent strength and keep the trend going.
In a simplified way, we will either enter in the Supply/Demand in a trend setup or Trend Changing setup.

