

USD/CHF Trade Review
This trade was taken in the 5 minutes timeframe at the today’s London session. There were 2 things going for the trade:
- The background was strong at the time
- There were multiple demand signals nearby (strength)
But sometimes the market only gives 1 shot, and this was one such example – the opportunity was missed when there was a down bar with about average volume. The trade was taken when the rally was already underway, and the volumes were drying up.
Background (15 minutes): Strong
Support: 1.0400
Resistance: 1.0479
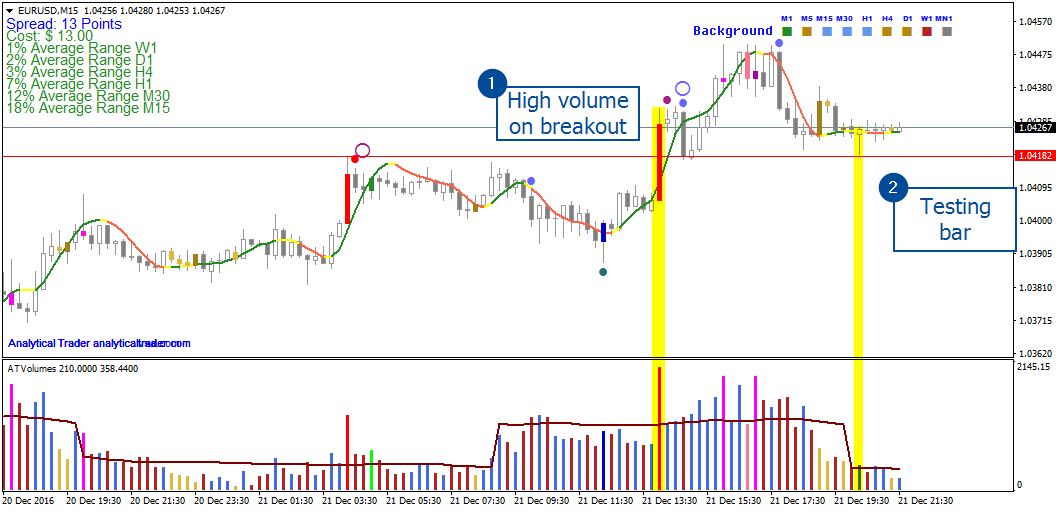
Euro/Dollar 15 minutes
Euro/Dollar just broke out from an important accumulation pattern of the last few sessions, that peaked at 1.0418.
- At point 1, we can see that the breakout was on good volume. Together with the buying seen in the pattern’s lows, this shows strength, and we should be looking for a long trade at the moment.
- This was a testing bar, testing for supply at the resistance. If prices keep staying above 1.04182, there is probably not enough supply for a downtrend, and we can expect further rises in prices.
Suggested Strategies
- Look for a low volume down bar, or a demand bar by tomorrow’s London session, for a long position. Make sure to close any trades before 1:30pm GMT, as unemployment claims and the final GDP numbers for US are coming out.
- If prices dip below the critical price 1.0418, re-evaluate depending on what happened during the most recent news.
If you wish to trade EUR/USD with our indicators for free, you can try it here.
Background: Weak
Entry reason (1st trade): Low volume up bar on resistance, with weakness behind
Close reason (1st trade): Demand signal
Entry reason (2nd trade): Low volume up bar and failed test

Euro/Yen Trade
Following up on last week’s post about Euro/Yen, upon reaching the resistance, this pair continued to show supply just above the zone at 123.44, and the background soon turned weak.
- First short trade on the break of a low volume up bar, inside the weak zone. Closed when there was a demand signal, and the traded end up being barely break-even.
- I took another short trade on the break of a low volume up bar. This was also a failed test, which showed further supply. Holding the trade until the support at 120.900, or further strength in the market.
We have just released the video explaining the most recent indicator, Congestions. It’s an indicator that detects certain supply and demand patterns which form buying/selling zones, and serve as supports/resistances.
This is an improvement over standard supports/resistances, that don’t really take real supply/demand into account to draw the resistance areas, which has to be seen by the volumes. This results in more reliable and predictable resistance areas.
You can check the video below:
Hourly Trend: Down
Resistance: 122.800
Support: 122.142
Euro/Yen Hourly

Euro/Yen Hourly – Trend Changing
Euro/Yen’s been trending for the past 2 weeks, but on today’s Tokyo session, the up trendline that was in control, just broke.
Point 1: In this top, there was heavy supply by professional traders pointed out by the VSA indicator [Free Demo], as the market made a top on high volume, and went into a downtrend in even higher volumes. This happened when touching a weak congestion zone (selling zone) above, and all together, it’s a common reversal sign.
Point 2: On the reaction a few days later, the market reached 122.970 on low volume (volumes lower than average). With such selling behind, this is never a good sign, and the market then went on sideways.
Current time: As the ranges have been narrow for the last 2 sessions, this action can be better understood in a lower timeframe, such as 15 minutes.
Euro/Yen 15 Minutes

Trading Range in Euro/Yen 15 minutes
In the 15 minutes, we can see that the market is in a trading range, with a buying zone below, and a selling zone above. The current rally is happening on high volumes, and so it’s likely for the trend to continue until 122.8.
Suggested Strategy
Wait for prices to go to the resistance at 122.8, and look for further supply or low volume up bars in the hourly timeframe.
Dynamic trend: Turned up
Background: W1 – very weak; D1 – weak
Phase: Markup
Support: 1.066
Resistance: 1.079

EURUSD: Hourly
Considerations
Point 1: We can observe “Shakeout” with very large volume and a wide range, on a weak congestion zone. This movement alone indicates absorption of supply, but the subsequent down-bar indicates that the supply is still high, and the market is not ready to grow.
Point 2: “Test” with a low volume and an average range. Follow up-bar indicates the success of the maneuver.
Point 3: There was a breakout of the congestion zone with a high volume and wide range. In TF M15, a successful test occurred and then continued to grow.
Suggested Strategies
Strategy 1: Consider buying if:
- The price breaks out the resistance level 1.079 and
- «No supply» occurs.
Strategy 2: Consider to buy if:
- The price pulls back to the support level 1.066;
- «No Supply» appears (down-bar with a narrow range and a low volume);
- And the price reverses up.
Strategy 3: Consider going to sell if:
- The price breaks down the support level 1.066 and;
- «No Demand» appears (up-bar with a narrow range and a low volume).
Tips
You can search «No Demand» and «No Supply» on a lower TF.
Know more about CONGESTION ZONES

