
In last April 5th there was some volatility caused by major news like the PMI in Europe, UK, and the US. The US also released the Crude Oil Inventories and the Fed Minutes. Despite this, the Alert System was able to catch some major moves outside of the news’ release. Below you can find some trades made throughout the session, with explanatory comments.
1. USD/CAD 15 Minutes – VSA SHORT Alert

Here we had a weak VSA signal with above the average volume showing supply. 3 bars after the short, the trend rebounded and volume started showing demand. Closed 1/2 when it hit TP1 and position was closed near the break-even level.
- Short on weak VSA signal (sell stop order). Placed the Stop-Loss and Take-Profit at the suggested levels.
- Close 1/2 trade at the blue dot level, +8 pips.
- Close trade when trend rebounded, a little above the opening price. Nearly break-even.
2. GBP/JPY 15 Minutes – Dynamic Trend LONG Alert

This was a case in which the Dynamic Trend Alert was able to indicate a major and fast move in GBP during the session. Because the signal was strong and the volume above the average, it was secure to close the whole trade at the final TP level.
- Long on dynamic trend alert (buy market order). Placed Stop-Loss and Take-Profit at the suggested levels.
- Hit take-profit 45 minutes later, +43 pips.
3. CAD/JPY 15 Minutes – Dynamic Trend buy signal

- Long on dynamic trend alert (buy market order). Placed Stop-Loss and Take-Profit at suggested levels.
- Close 1/2 trade, +10 pips.
- Hit take-profit 4 hours later, right before a major demand volume, +24 pips.
As the trend remained strong, the suggested TP could be canceled. Instead, you could wait for some signals of weakness to close the position and let the profits run.
4. AUD/USD 15 Minutes – INVALID VSA Signal

This VSA signal was invalid and wasn’t taken because:
- There was a resistance below the take-profit levels.
- The signal occurred after a very wide demand bar. When the volatility is too high, wait for a correction + low volume bar to go long instead.
This is a case in which the signal and respective buy stop order appeared too late to catch the main rally. Traders should not enter the market at this point, with a resistance nearby.
Yesterday there weren’t any particularly important news events, but in the 5 minutes timeframe it was still possible to catch a few moves with the Alert System. Below you can find the session’s resume, with the comments on why each trade was taken, and why they were closed.
EUR/USD 5 Minutes – Dynamic Trend SHORT Alert
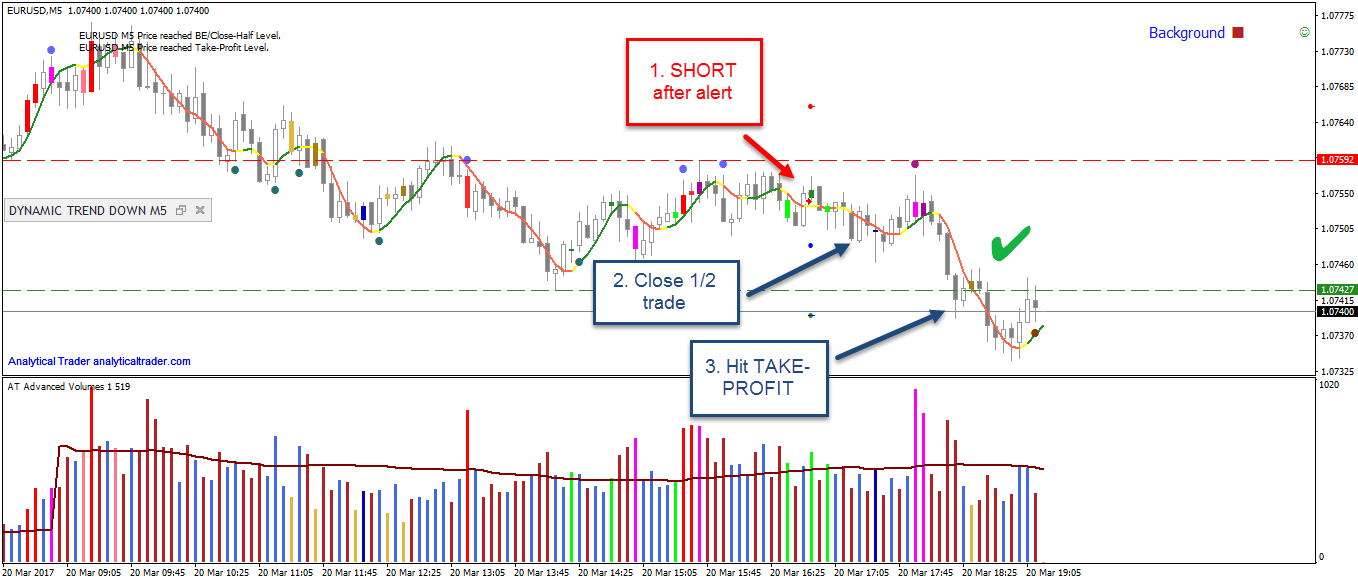
- Short on dynamic trend alert (sell market order). Placed the SL and TP at the suggested levels.
- Closed 1/2 trade at the blue dot level
- It hit take-profit about 1 hour later, for +15 pips
USD/CAD 5 Minutes – INVALID VSA Signal Alert

This VSA signal was invalid and wasn’t taken due to:
- Mixed supply/demand signs at this price level. When this happens, avoid taking long or short trades
- Long-term resistance just above
AUD/USD 5 Minutes – VSA Signal SHORT Alert

This short trade was taken at the suggested execution price, and the stop-loss and take-profit set at the suggested levels. The alert was valid, but soon the market started to show strength.
- Short as sell stop-order at the execution price
- There was a churn bar, which is a demand sign in this context (during downtrend). 1st sign of strength
- Low volume bars on a 2nd attempted movement. CLOSE trade here, on the 2nd sign of strength. The trade closed barely BREAK-EVEN
EUR/JPY 5 Minutes – VSA Signal LONG Alert

- Long as buy stop-order at the execution price
- Close on the TAKE-PROFIT for +10 pips
If you have read the VSA user guide before, you might have noticed that there is actually distribution by the end of the Tokyo’s session, before this alert took place. So shouldn’t we avoid taking long trades? To go long after distribution, you want to see signs that there is no more supply to take prices lower, and that’s exactly what happened in EUR/JPY. The market went lower on low volume, and the VSA signal was actually a supply test which was successful. The alert was still valid because of that reason.
Hope you found this trading session review useful. Try our demo if you want to see some of the indicators in action, and do subscribe to our blog to receive new market updates.
In this trade, I went short after VSA gave a weak signal, together with the weak background + weakness nearby for quick 30 pips. It’s usually a strategy that works in London open, as volumes tend to spike at these hours.
Taking the VSA signal at London Open
- The background analyzes both the trend and supply/demand signs in the market. In this case, it was showing that the market was weak, which means you should be looking for shorts
- The market showed weakness behind, seen by the wide high volume (red) down bar, closing on the lows. This is a supply sign, that is even more important during a downtrend.
- Finally, a weak VSA signal (minor supply) triggered the trade, and a sell-stop was used at the bar’s low.

Trading London’s Open in EUR JPY

USD/CHF Trade Review
This trade was taken in the 5 minutes timeframe at the today’s London session. There were 2 things going for the trade:
- The background was strong at the time
- There were multiple demand signals nearby (strength)
But sometimes the market only gives 1 shot, and this was one such example – the opportunity was missed when there was a down bar with about average volume. The trade was taken when the rally was already underway, and the volumes were drying up.
Background: Weak
Entry reason (1st trade): Low volume up bar on resistance, with weakness behind
Close reason (1st trade): Demand signal
Entry reason (2nd trade): Low volume up bar and failed test

Euro/Yen Trade
Following up on last week’s post about Euro/Yen, upon reaching the resistance, this pair continued to show supply just above the zone at 123.44, and the background soon turned weak.
- First short trade on the break of a low volume up bar, inside the weak zone. Closed when there was a demand signal, and the traded end up being barely break-even.
- I took another short trade on the break of a low volume up bar. This was also a failed test, which showed further supply. Holding the trade until the support at 120.900, or further strength in the market.

