
Dynamic trend: Turned up
Background: W1 – weak; D1 – strong
Phase: Markup
Support: 113.60
Resistance: 116.00

USDJPY: Hourly
Observations
Point 1: There was a breakout of the resistance level, with an average range and a high volume. The following up-bar confirmed buying. In addition, on a smaller TF, we can observe a successful testing after this breakout, which confirmed the validity of this movement.
Point 2: We may see a “Shakeout” with a wide range and very high volume. Because the subsequent bar was a down bar, and the volume was high, we may conclude there is a large supply in the market, which must be tested.
Point 3: A second breakout of the resistance level (113.60) occurs.
Suggested Strategies
- Consider buying if “No Supply” appears (down bar with a narrow range and a low volume) near the support level 113.60.
- Consider selling if the price breaks down the support level 113.60 and “No Demand” appears (up bar with a narrow range and a low volume).
Tips

Yen Near Support, Breaking Out
In the last post, we suggested to buy USDJPY in case low volume down bars (no-supply bars) showed up near the previous resistance level at 111.8. Many low volume down bars appeared at those prices (point 1), which provided the entry opportunity. The prices didn’t break 111 to the downside, and so, we maintained our bullish view of the market.
The trade was closed in point 2, on a supply sign. It was also getting near the previous selling zone at 113.5, and it ended up being the starting point for a reversal.
After a brief correction and low volumes on the bottom, the prices kept on rising and soon reached the long-term resistances at 113.8, and 114.5. A breakout of this last resistance at 114.5 (point 3) could provide another long opportunity, as long as one is alert for potential reversal signs, as the trend is already somewhat extended.
Dynamic trend: Turned up
Background: W1 – weak; D1 – strong
Phase: Markup
Support: 111.80; 111.00
Resistance: 113.60

USDJPY Hourly 28-11-2016
Analysis
Point 1: There was a breakout of the resistance level with a wide range and a high volume bar. The following up-bar confirmed demand. Moreover, on a smaller TF we can observe a successful test after this breakout, which confirms the strength.
Point 2: we can see a “Potential stopping volume” with an average range and a high volume. Because the subsequent bar was a down-bar, this maneuver is not confirmed, however, we should take into account that the strength comes on down-bars, and in the case of a successful test level around 111.80 and 111.00, we will be going long.
Suggested Strategies
Strategy 1: Consider to go long if:
- Price pulls back to the support level 111.80 or 111.00 and;
- “No Supply” appears (down-bar with a narrow range and a low volume) and;
- The price reverses.
Strategy 2: Consider buying if:
- Price breaks out the resistance level 111.60 and;
- “No Supply” appears.
Strategy 3: Consider selling if:
- Price breaks down the support level 111.00;
- “No Demand” appears (up bar with a narrow range and a low volume).
Tips
You can search for «No Demand» and «No Supply» signals on the lower TF.
Dynamic trend: Turned up
Background: W1 – very weak; D1 – weak
Phase: Markdown
Support: 1.055
Resistance: 1.066

EURUSD Hourly
Point 1: There was a potential “Selling Climax”, with a very high volume and a wide range. The subsequent bar was an up-bar, which indicated buying pressure.
Point 2: Represents a “test” with low volume and a narrow range relative to point 1. The following up-bar confirmed the success of this maneuver. Low volume when breaking out the latest low, indicates no selling pressure
Point 3: There was a “Shakeout” with a normal volume and a wide range.
Conclusions: The recent action is bullish, and indicates market strength. However, we should wait for the confirmation of the 1.066 level”
Suggested Strategies
Strategy 1: Consider selling, if:
- Price pulls back to the resistance level 1.066 and
- «No Demand» appears (up-bar with a narrow range and a low volume) and
- Price reverses down.
Strategy 2: Consider selling if:
- Price breaks down the support level 1.055 and
- «No Demand» appears.
Strategy 3: Consider buying if:
- Price breaks out the resistance level 1.066 and
- «No Supply» appears (down-bar with a narrow range and a low volume).
Tip
You may search for «No Demand» and «No Supply» signals in the lower TF.
Dynamic trend: Up
Background: W1 – weak; D1 – strong
Phase: Markup
Support: 107.00
Resistance: 107.80

USDJPY Markup
In point 1 there was a “Shakeout” with a wide range and a very high volume. Following up-bar confirms buying. After a period of growth this price movement shakes out weak holders.
In point 2 there was a “Test after shakeout” with an average range and a normal volume. The volume was significantly lower than in point 1, which indicates the absence of selling pressure. The growth of prices after the test was confirmation of success of the test.
In point 3 there was a bar of the breakout of the trading range with a wide range and normal volume. The relatively low volume of points to the decreased interest of Smart Money to increase prices. Possible imminent market reversal.
Suggested Strategies
Consider buying if the price pulls back to the 107.00 support level and “No Supply” appears (down bar with a narrow range and a low volume). Consider selling if the price breaks down the 107.00 support level, and “No Demand” appears (up bar with a narrow range and a low volume).
You can search for «No Demand» and «No Supply» on the lower TF.
Tomorrow, on 8th November, the US presidential elections begin. Up until now, the dispute on the presidential race between Hillary Clinton and Donald Trump has been a fierce battle. The polls have been mostly in favor of Hillary, although Trump has been gaining terrain in the last 3 months. Three months ago, Hillary had an advantage, in average, of +8pts ahead of Trump in the polls, but mostly due to Clinton’s scandal with the confidential emails which involved an FBI investigation, Clinton now leads Trump by just 3 points. On some polls such as LA Times/USC Tracking, Trump is the leader (+5 pts), and in Gravis, Hillary and Trump are tied. So, everything is still possible, and if there’s one thing that Brexit taught us traders, was not to rush to conclusions too soon.
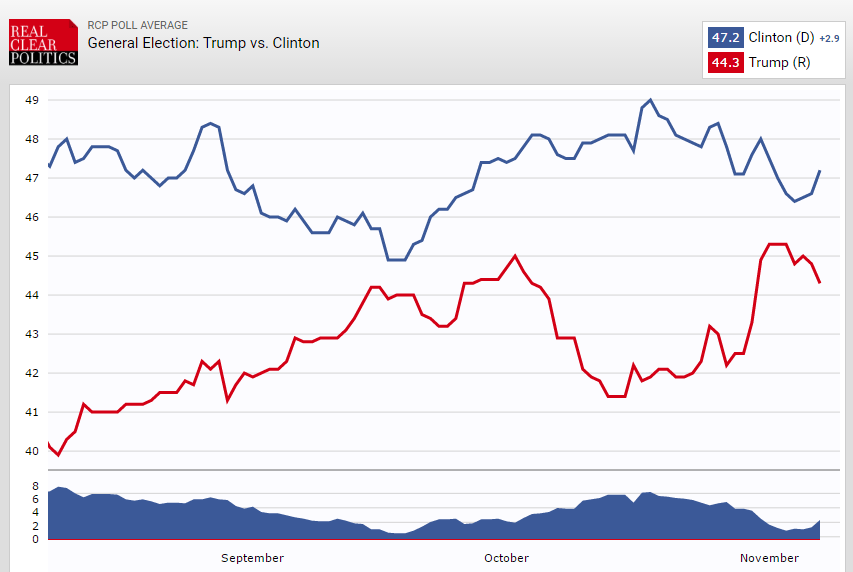
Clinton vs Trump Polls
What are the effects in the Forex markets?
This is a unique presidential race – Donald Trump is a man with many diverging ideas from the mainstream Republican ideology, such as on protectionism, foreign policy, and immigration policies, and so, the latest presidential races (such as George W. Bush election) aren’t a reliable indicator of what’s going to happen to the markets if the Republican candidate wins this one. Personal opinions aside, what everyone can agree on is that if Trump wins, he would bring quite some changes and unpredictability, at least at the beginning, to US politics and economy. Unpredictability brings volatility, and that’s what we can expect on a Trump’s victory. US Dollar would fall sharply, due to an expectation of a capital flight out of US Dollars to safe-haven commodities and currencies, such as gold and the yen respectively.
Clinton, on the other hand, is a more predictable candidate, and the markets know what to expect from her presidency if she wins. US Dollar will be strengthened since the unpredictableness from the elections will be gone, and safe-haven currencies and commodities (Yen and gold), would weaken for the same reason. The movements are skewed, though – a Trump win would give rise to extreme movements, while Clinton’s victory would mean more moderate movements. The table below resumes these effects:

Clinton vs Trump – Effects in the markets
A way to approach these elections could be to bet for a Trump’s win, as his win would move the markets more sharply than Clinton’s win (and hence, would give a favorable risk to reward), but since his election probability is also lower due to the polls results, it would certainly be a very risky shot. The wisest thing to do is to stay out of these assets until the votes are counted, as a period of high volatility is to be expected during the voting day, and after the candidate is chosen.

