
Starting from the end of January, we saw a steep down trend on the
USD/JPY. On the 11th February (zone 4) we can see large volumes at the bottom of the
market and as a result the price moved up and gained the level of 114.840, changing the structure of
the trend. Afterwards the market was stuck in a range (zone 5) and volumes have decreased. Such price
behavior at this zone can be seen as a no demand signal and is interpreted as lack of interest to
buy at the current price from large players, which prevented further price advances.

On the four-hour timeframe chart we have 5 zones, in which we can see the activity of the large players. Zone 1 is the beginning of bearish trend, where there was Major Supply from VSA on the current and above timeframe.
Zone 2 showed a thrust bar (the red bar), a bar that made a lower low than the previous. This pattern means that the large players tested the local level (117.50), and after confirming the lack of interest to raise the price (volumes were low afterwards and the price reversed from that level), bearish trend continued.
In the 3rd zone there is a continuation of the down trend, however there are also few demand signals below that zone. There is a demand on the daily chart and minor demand on 4hour chart. Taking into the account these signals individuallny we could assume, they they indicate the reversal of the market. However we should not forget that in the VSA method it is important to consider the wider picture of price movements in order to understand what is currently happening. It is important examine the background, which was weak a the time. In this context, these could have been locked-in traders getting their stop-losses hit, below the support.
The 4th zone turned out to be the point of the trend change. There are two large candles with a big volume, after which and the price starts to go upwards, breaking the previous structure of the trend. And the 5th zone, as it was mentioned in the beginning of the post, appears to be no demand signal, which led to a continuation of the down trend.
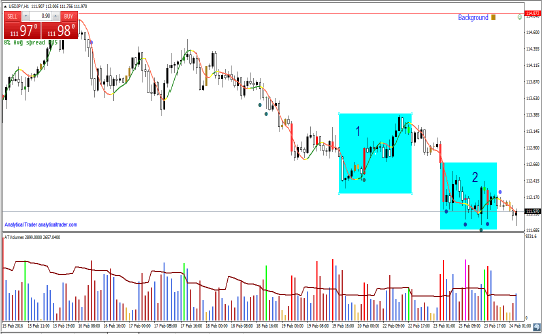
The hourly chart shows an attempt to make the move up (zone 1), which after churn bars, lead to the rapid fall of the price. In the zone 2 there are few bullish signals such as demand and minor demand. Obviously, they must be also interpreted in the context of general background which is weak, so it is too early to talk about the reversal. It is possible that the these signals were the result of hitting the stoplosses of the traders who held long position in the zone 1. At this point, the best solution would be to search for an entry point for a short position if more supply shows up, and at a better price.
On the last post about AUDUSD, I wrote that prices were on a trading range between two major supply and demand zones. I noted that an up reversal on H1 had just appeared, and it would be a good idea to enter if the bar’s high was broken. On the Asian session (9pm UTC) it was broken, and a long was taken here. Prices went on to correct yet again, but more demand showed up, and later another up reversal. This was the entry opportunity #2.

AUDUSD – Volumes and Reversals Trading
When prices rose up to the supply zone, this was the first warning to start being careful. I exit when there was a supply signal in this same zone. A few bars later, a down reversal appeared, and the market went crashing down.
M15
In M15, given the recent weakness, the background is just showing just that. It would be interesting to see a break of the 0.713 support for weakness confirmation, support which was formed by a shake-out. To the upside, with a strong background, strong VSA signals or up Reversals could be traded above the support.

Australian Dollar went through a 90 pips fall in prices on the US session today, partly because of RBA recently communicating the reasons behind maintaining a low cash rate, with no prospects of raising it soon, and also because of the recent movements in gold, which influences Australia’s major gold exporter economy. Looking at prices and volumes, we can see the same picture – a top in very high volume and several Supply signals, without the volumes slowing down on the way down, and with a weak background.
There are 2 important zones to note in this chart – first, the distribution top, and second, a recent low which showed demand on really high volume. These were the last major professional sell and buy points, respectively, and so they should be the trigger zones to trade, either on a bounce or a break-out – the market will tell. If I see more demand signals near this area I expect the prices to rise yet again, as the professional money is clearly showing it’s buying this bottom, and not letting prices go below their last major buy point.

Control Zones AUDUSD M15
On H1, what jumps immediately to the eye is the major shake-out, which VSA marked as Major Demand; that major demand is what’s dominating this market. Looking at Reversals, we can see that on the highest sensitivity they have been showing all the tops and bottoms, and just 1 hour ago an up reversal was seen. The break of this bar’s top in the next hours would be a good buy point, and looking at M15, that would also be the break of the recent low volume up bars. The areas on M15 should be then watched, and special attention given to other reversals or VSA signals for exits.

After the high volumes that was noted on the last post (zone 1), I wrote that if prices failed to continue the rally soon, this would be a sign of too much supply hitting the market and would be a probable reversal point. In the Asian session the prices failed to rise, and a bit more supply showed up as a churn bar (green bar) after a small rally. When the London session opened, the prices went down to re-test the previous area of demand.
In (2), we can see that the volumes picked up again, and VSA showed a demand signal. The volumes were also higher than the last top, which was a good indication of renewed interest in the up move. As the background was still strong at the time, Alert System indicator sent out an alert to go long on the high of this demand bar.
Prices continued to rally afterwards, and upon reaching a medium-term resistance at 1.138, Supply signals from the current timeframe and from D1 halted the move.
In (3), we can see a successful test (the test is the dark blue bar, 3 bars ago) near the prices of the previous demand, as the prices broke its high. The background is weak though, and so taking a long right now, while possible, is risky and would have to be with a tight stop-loss. Other EUR pairs such as EURJPY are looking better, since it’s just now emerging from a double bottom with demand as the current prices.

EURUSD H1 Demand Signal + Background
EURUSD has been in a strong uptrend after breaking out from a base last week. The prices also broke an important down trendline in a furious up movement, on high volume and wide range up bars. It’s now in a critical area that will be characterized by a high volatility.
In areas of previous resistances, this volatility and volume spikes are normal, and can be somewhat tricky to understand, but using VSA and Reversals this job is simplified as they’ll show the most important bars. We should first look at the background: it was strong during these movements, and so we should look for up reversals. In the hourly chart, the first one (zone 1) appeared at the same time as major supply, which is something to avoid. The other two (zone 2) were in an area of previous demand, and were soon confirmed by another strong VSA signal. Down reversals on the other hand, signaled less significant movements that lasted for a shorter amount of time.

EURUSD H1 – VSA, Volumes and Reversals
On to the current action (zone 3), Reversals showed a down Reversal, which marked almost the absolute high of this correction. Apart from that, after these such high volumes, I’d expect prices to continue further with small or no retracement. If they don’t keep advancing, it means much of that volume was supply hitting the market. The market has to show it’s not being conditioned by the supply anymore, with low volume bars or a successful bullish test, above the previous resistance.
In my previous EURJPY analysis I pointed out that the prices were just testing a down trendline, and given the accumulation seen behind, it’d be wise to wait for an up-breakout of the resistance. Subsequently, this trade was taken based on these developments:
- The background was strong at the time of breakout, which maximizes our chances.
- There was accumulation behind, shown by multiple demand signals without the price going to new lows. Note: there is a difference between the older post chart and this one, as the previous was from GMT-5 feed, while this is from a GMT+2 feed, both in Oanda. Nonetheless, the market picture is fundamentally the same.
- The break-out showed increased volume not exactly on the break-out bar, but in the next one. This is usually fine, but I prefer to wait for confirmation when this happens. The confirmation was given a few hours later, after the low volume down bar was broken to the upside, showing clear lack of supply in the market.
- The first warning sign to exit was the extreme volume up bar, with no follow-up. Later a Supply signal from the Daily showed up, which confirmed the weakness. Closed when the trend turned yello. The take-profit from an alert would give an exit around these prices as well. However, if you have the time to manage your trade, and can react to changing supply/demand in the market quickly, trading without take-profit with this system also works.

Right now I’m holding a short position in the daily, as this weakness is just below a long-term down trendline. The correction is seeing relatively low volumes, but that could be normal after the distribution seen on the red bar. Either way, the trend is still down, and so, I’m just watching where the market takes me for now.

