

- In case background is neutral in the current timeframe, you should check above timeframe. It must be strong for long entry.
- There are no strong signals before entry. It is a mistake to go long here. You see that the price is near long term and short term resistance (they are very close to each other). These resistances are a barrier for higher prices. If professionals were ready to cross this barrier we would have seen strong signals and up bars with wide spreads on high volume. Here we see no preparation for this move.
- Dynamic trend turned from red to green – it is o’k for long entry.
- This is not a good point to enter the market. For long entry you should look for down bar on low volume (no supply) – like previous bar.

This trade was opened based on the previous EURUSD analysis.
- Overall background is weak.
- Price was close to the resistance level (1.146) which several times has proved itself in upper timeframes. Here appeared weak signals.
- Dynamic trend turned from green to red. Entry – when the price comes closer to the dynamic trend. Stop-loss above the resistance level. After I saw strong signal I didn’t close the trade, because I thought that bear move still had potential. Strong signal here may be caused by triggering stop-losses of traders who went long when the price crossed previous high. But I moved stop-loss closer in case I was wrong.
- Exit by reaching take profit level.
Total: +112 Pips

In the previous GBPUSD analysis I noticed that the price was approaching Long Period Support and wrote that it is possible that the price starts reaction to the downward trend. Later I saw in the chart strong signal (Minor Demand). There was no high volume bar (effort) which was necessary to pass the support and it was clear that now we should expect prices to go up. It does not mean that this is a good point to go long, because background is still weak. But this would be wise to close short positions in this point.
The price was moving up, but the background was still weak. Therefore I waited supply or no-demand signal (better if it was near resistance) to open a short trade.
I found a good setup in M15 Timeframe:

- The background is very weak.
- Price is approaching Long Period Resistance.
- Here we can see at once several weak signals (supply), price is near the resistance.
- Dynamic trend turned from green to red, entry in up-bar. Stop loss above the resistance, later moved to break-even.
- Strong signal (Minor Demand): in VSA this is a shake-out – wide spread bar on high volume (weak holders are still selling, but strong holders already have bullish view in the market – that’s why high volume and bar closes on the high).
- Exit: Total 67 Pips.

GBP/AUD was near a support after the low at 18th June (red line below prices). Everything fit into place in this trade for the Support/Resistance trading setup.
1. Background was neutral
2. Demand signals near the support, which is the smart money buying into a previous area of demand
3. Went long in a test-like bar (part of long type bars), shown by the volumes indicator
4. Exit in a weak signal. Holding through the weekend and exiting on the trailing stop was also OK
Gold (XAU/USD) and Silver (XAG/USD) are naturally, two very correlated commodities, and the recent action is no exception.

Gold is near a support and a previous broken trendline. There was recent strength (blue signal) with moderate volumes, in an area of previous strength, which could be the first signal the support is holding, but so far the market doesn’t show signs of stabilizing – it keeps making new lows, and the background is still weak.

Silver is too near a support, and in the mid of a down trending channel. Given the price range silver showed today, and the fact it broke a previous support at 15.8, it was expected that the recent strength has higher volumes than in gold, since more traders and stop-losses were ‘shook-out’. Like gold, it’s making lower lows, and the background is still weak mostly due to the downtrend. I would like to see a rally to finally break the downtrend and confirm the recent strength was in fact accumulation; if the downtrend is to continue, it’s probably going to test the demand at 1162 in gold, which occured in early June. In the case the market rallies and it gives an opportunity to enter, I’d be more inclined to invest in silver rather than in gold, or at least to have a larger position in silver, as XAU/XAG (Gold/Silver ratio, tradable in some brokers) is showing major selling, which it’s preventing it to break a key resistance.

This pair has been showing significant supply at 1.25 and up, with no previous resistance, which means it isn’t overhead supply (which is usually not something to worry about). The most significant resistance is at 1.25369, which is the high of the previous supply bars. There is a trendline coming from almost the beginning of this rally, since 12th May, which is the level to watch for an eventual short trade.
There is a high chance there will be a fake break-out, in order to get more longs trapped and to catch the stop-losses of shorts, which would confirm that this is in fact distribution. This would be a break-out with either low volume, or a break-out with supply signal right above the resistance after it was broken. To the downside, a break-out of the trendline with good volume would be a trend change signal, if the background keeps at being weak, and given the weakness behind. At the moment the pair is making successive higher lows, which means that for now the prices are being supported, and the dynamic trend is giving the same indication as it’s still up.
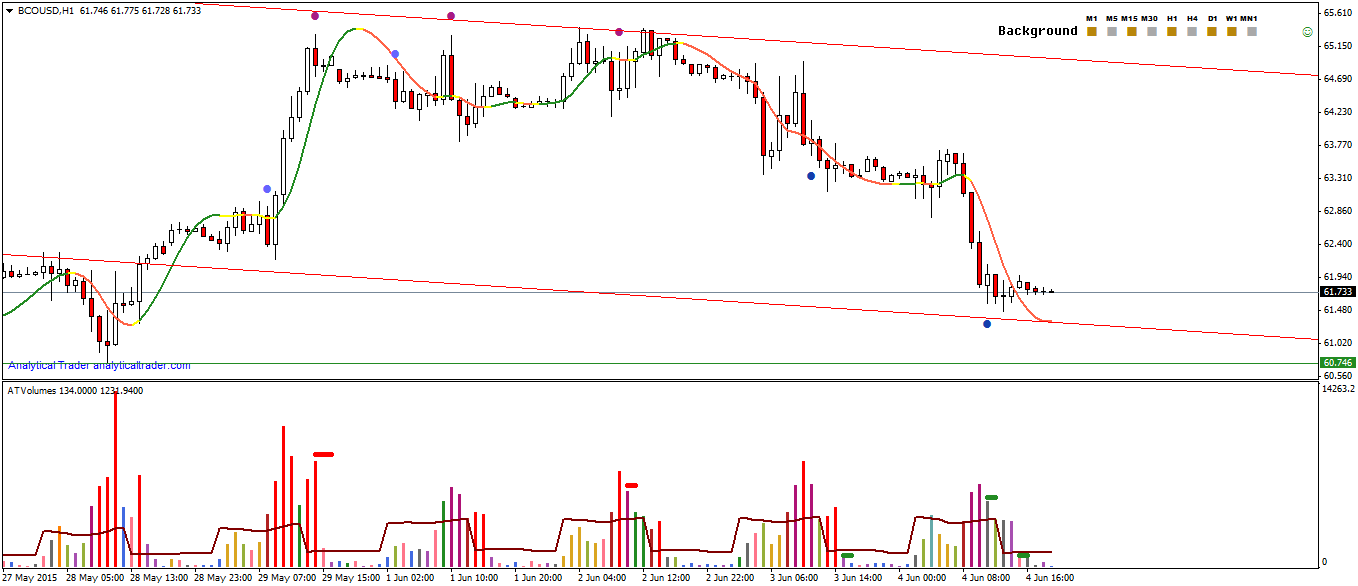
Brent crude oil, which is related to the Canadian Dollar, as Canada is a big oil exporter, is on the lower part of the trend channel, and recently showed a demand signal, at a previous strength area. It’s not showing the sideways movement as USDCAD is though, so I’m waiting for prices to stabilize at this level or to make a higher low, and for the background to change to strong.

