
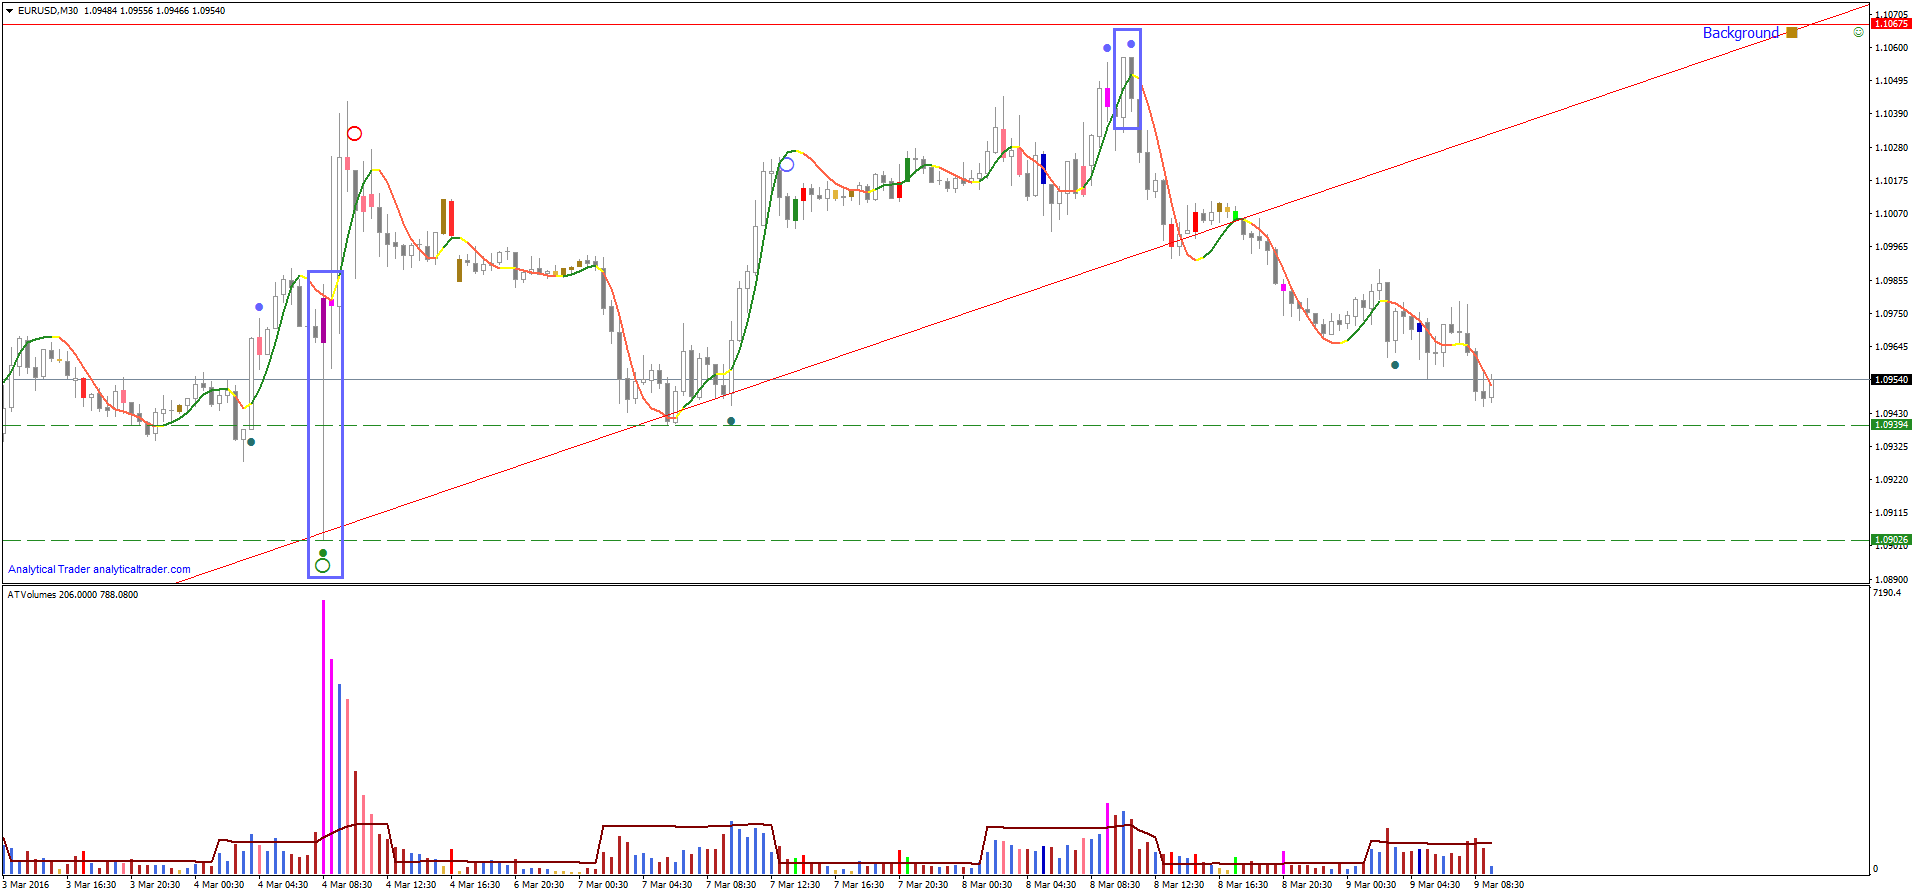
Like I wrote in last Monday’s post, it was likely for the uptrend to continue due to the major shakeout, in the first blue rectangle. After the rally on the Asian session, yesterday by the end of NY session, we have seen one good VSA setup which will often mark as Top Reversal, near a zone of previous supply.
The reason why we commonly should consider this as sign of weakness are:
1. Volumes were decreased on two up bars when this candle tried to break 1.1050 level.
2. On the second try, which is marked in the 2nd blue rectangle, confirmed this as Top Reversal. Combination of two bars give us insight that supply has swamped the demand. First bar is marked up with very high volume and closing on the highs. And the next bar rapidly reverses down on a wide spread and closing on the lows.
The market went down quickly after, which gave no opportunity for a confirmation, in the form of an upthrust or no-demand bars. But as there was an up trendline nearby, its break would be another confirmation (Trendline breakout), of course, if you happened to be watching the markets in the mid of Tokyo’s session! EURUSD kept on downtrending and only more weakness after a significant rally would give another opportunity for a short. Below the support at 1.09394 I expect more demand to show up, as the trades who bought at the shake-out earlier might still be interesting in buying more at those prices.
Distribution, Trend Changing in Eurusd
GBPUSD
After the confident 1.42450 and 1.40650 support breakout, prices haven’t managed to make the same thing with 1.38460 support, and now British Pound market tests the 1.40650 resistance level.
During previous 2 weeks bearish market confirmed its sentiment:

In point 1 prices tested 1.43890 resistance level which showed the interest from institutional players and was marked by VSA Indicator as W1 supply signal. Before that, in point 2, market showed, that there were no strong signs of the imbalance near 1.42450 support level which meant, that big players were not going to change its short positions to long ones.
There was a 1.42450 support level breakout on high volume which again showed initial sentiment of the market. As the result of that breakout, the 1.40650 support level went through as well, and the steady downfall of the market stopped at the level 1.3846.
Points 4 and 5 suggest that minor demand signals and low volatility on the bottom of the market is not the sign of the bearish trend finishing. The beginning of a sideways is possible, which is confirmed by neutral background.
Due to the absence of stronger demand signals on the bottom of the market, now it is too early to speak about the change in GBP market sentiment. In current situation it is important to see how the market will behave near the 1.4065 level and above it, if such situation happens. In case of a supply signal near the resistance, or no demand with a volatile down candle after it, it’s possible to take a short position, but only on weak background.
If there is 1.40650 breakout candle on high volume, it will be the time to start searching for long positions.
GBPUSD H4 – Downtrend and VSA
EURUSD
Having tested the 1.10050 short-term support in the point 1, the Euro went above 1.10440 level, and revealed, that there was no smart money interest near the 1.10684 long-term resistance, which was confirmed by low volumes in the point 2. The point 3 is the place where prices went beyond the 1.10440 level, and above average volume on down candle with the supply from VSA indicator showing the bearish sentiment of the market.

EURUSD – Downtrend and Volumes on market Bottom
In the point 4 there was the 1.10050 and 1.09590 support breakout on high volumes – the good sign of confident bearish trend. Next evidence of down sentiment of the market is the point 5, the place, where prices successfully tested 1.09590 level resistance – it remained unbroken. Moreover, it was the good place for big players to add to short positions – that’s what they did, as the high volume volatile down candle showed. After that the 1.09150 level was went through, and the market eventually paused its down motions by 1.08380 level.
The current market situation can’t be called the end of the bearish trend due to the absence of the strong demand VSA indicator signals and to weak background.
Undoubtedly, there are demand signals in the point 6 and 7, but the volumes are not too high to be stopping volume and the up candle volatility after it, is around average.
So in the current situation the full picture will be seen at the 1.09150 resistance level. In case of high volume breakout candle, previous short positions should be closed and possibly reversed for long positions. If there are supply signals at the 1.09150 resistance level or low volumes near it as no demand signal, it’s possible to open new short positions or to add to current shorts.
Sterling (GBPUSD)

GBPUSD H4 – Trend and VSA
From the beginning of February we saw a downtrend on GBP/USD. After 16th February’s support break out on level 1.44000, there was a bear sign on the point 1 and 2. In the point 1, there was a supply candle near mid-term resistance level, which was detected by VSA indicator. Next, a high volume down candle appeared 22 February on the support breakout which approved the bearish sentiment. Then the signs of bearish work were evident in the point 3 and 4.
Point 3 was the first 1.41000 resistance test on high volume, and in the point 4 market showed that there was no demand above the resistance level, but the price is attractive to add to current sell positions or to open new ones, and prices fell sharply breaking out 1.39000 resistance with the support of opening sell positions of institutional investors and other big players.
The situation near the 1.41000 level is represented in top right corner of the screen, where new opening sell positions of big players caused upthrust – breaking the resistance up and then coming back down. After this dynamic trend turned down and it was the best opportunity to open short positions.
There are no bullish signals in the market, so trend tends to continue its step down motion. The possible position opening point will be the area near 1.39000 resistance, so in case of bullish intention absence at the bottom and supply power / no demand signals near 1.39000 level, sell positions are likely to benefit. Resistance tests and upthrusts will be good signals in this case.
EURUSD

EURUSD – Trading Range and Breakout
During the last 3 days, from 23th February, prices were trapped between 1.10450 resistance and 1.10000 support. Flatting within these levels, big players tested the market for the opportunity to continue the descending motion. 1 and 2 points were the resistance test places, which was shown by the indicator with supply dots. Point 3 was the place where institutional players saw that the market was ready for a small up walk, which showed on the chart as spring in point 4( peak near the bottom edge of the flat range, with prices dipping above the resistance and then coming back down again to below the resistance). After the low volumes showed that there was no demand above 1.10450 resistance level, and prices streamed down signed as low supply by the indicator purple dot, and break out the support on high volume(point 5) which confirmed bearish sentiment of big players.
The high volume down candle after the no demand above mid-term resistance level was a good sign to open sell positions with the stop loss above point 4 candle top. If there are no bullish signals such as the culmination of purchases( prices going down and up on huge, extreme volume), it’s possible to search for signs of supply 1.10000 resistance level for a short entry.
Starting from the end of January, we saw a steep down trend on the
USD/JPY. On the 11th February (zone 4) we can see large volumes at the bottom of the
market and as a result the price moved up and gained the level of 114.840, changing the structure of
the trend. Afterwards the market was stuck in a range (zone 5) and volumes have decreased. Such price
behavior at this zone can be seen as a no demand signal and is interpreted as lack of interest to
buy at the current price from large players, which prevented further price advances.

On the four-hour timeframe chart we have 5 zones, in which we can see the activity of the large players. Zone 1 is the beginning of bearish trend, where there was Major Supply from VSA on the current and above timeframe.
Zone 2 showed a thrust bar (the red bar), a bar that made a lower low than the previous. This pattern means that the large players tested the local level (117.50), and after confirming the lack of interest to raise the price (volumes were low afterwards and the price reversed from that level), bearish trend continued.
In the 3rd zone there is a continuation of the down trend, however there are also few demand signals below that zone. There is a demand on the daily chart and minor demand on 4hour chart. Taking into the account these signals individuallny we could assume, they they indicate the reversal of the market. However we should not forget that in the VSA method it is important to consider the wider picture of price movements in order to understand what is currently happening. It is important examine the background, which was weak a the time. In this context, these could have been locked-in traders getting their stop-losses hit, below the support.
The 4th zone turned out to be the point of the trend change. There are two large candles with a big volume, after which and the price starts to go upwards, breaking the previous structure of the trend. And the 5th zone, as it was mentioned in the beginning of the post, appears to be no demand signal, which led to a continuation of the down trend.
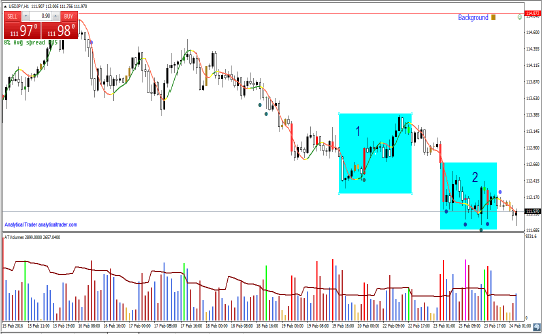
The hourly chart shows an attempt to make the move up (zone 1), which after churn bars, lead to the rapid fall of the price. In the zone 2 there are few bullish signals such as demand and minor demand. Obviously, they must be also interpreted in the context of general background which is weak, so it is too early to talk about the reversal. It is possible that the these signals were the result of hitting the stoplosses of the traders who held long position in the zone 1. At this point, the best solution would be to search for an entry point for a short position if more supply shows up, and at a better price.
After the high volumes that was noted on the last post (zone 1), I wrote that if prices failed to continue the rally soon, this would be a sign of too much supply hitting the market and would be a probable reversal point. In the Asian session the prices failed to rise, and a bit more supply showed up as a churn bar (green bar) after a small rally. When the London session opened, the prices went down to re-test the previous area of demand.
In (2), we can see that the volumes picked up again, and VSA showed a demand signal. The volumes were also higher than the last top, which was a good indication of renewed interest in the up move. As the background was still strong at the time, Alert System indicator sent out an alert to go long on the high of this demand bar.
Prices continued to rally afterwards, and upon reaching a medium-term resistance at 1.138, Supply signals from the current timeframe and from D1 halted the move.
In (3), we can see a successful test (the test is the dark blue bar, 3 bars ago) near the prices of the previous demand, as the prices broke its high. The background is weak though, and so taking a long right now, while possible, is risky and would have to be with a tight stop-loss. Other EUR pairs such as EURJPY are looking better, since it’s just now emerging from a double bottom with demand as the current prices.

EURUSD H1 Demand Signal + Background
Euro/Yen has been ranging since the beginning of January, when looked at from a 4-Hours perspective. Volume-wise though, it has been very active, and understanding this activity is essential to know what the major players are doing.
- First there were several demand signals just as 2016 was starting. This halted the down move. Afterwards there stopping volume when reaching 129.0 area (red bars).
- More recently, there was a major shake-out, painted as Major Demand by VSA – there was a lower low made, yet prices closed on the highs of the bar, and above the previous support. This was a move to hit stop-losses which provided plenty of liquidity for professional buying.
- Approaching the down trendline, there was a no-demand test (pink bar) – as prices penetrated the trendline, the volumes didn’t keep up, which means there wasn’t much demand. On the next bar, prices refused to close down though, on a relatively high volume. This could mean renewed interest in an up move, and the confirmation will be the trendline break on good volume (checking the hourly might be the best). If the bearish test succeeds, as in a failure to seeing a breakout of the trendline and/or test’s high in the next bars, I’d expect prices to drift downwards onto the support. The ultimate level to watch for is the resistance at 129.074.


