
After major supply knocked off the precious metals on a sideways trend, gold prices have been oscillating, with no clear direction. Silver on the other hand, has been slightly weaker, with a defined downtrend.
Gold
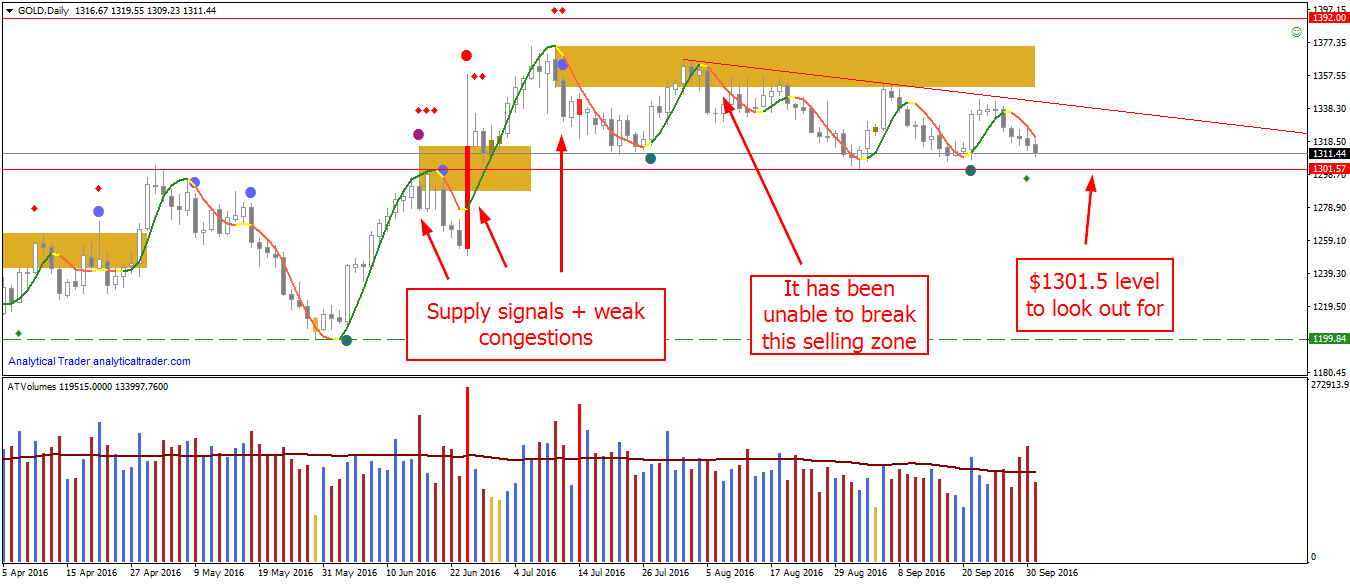
Gold Daily Chart Analysis
The most visible supply bar was the wide red bar by the end of June. The rally then continued on low volume, and more supply seen by VSA signals and weak congestion bars had been appearing.
A selling zone (congestion zone) was formed from the highs at $1370, and prices have repeatedly failed to break it, which along with the low volume in these rallies, suggests an overall lack of demand.
In gold, the $1301.5 level marks the distribution range low, and so its break would give a short opportunity in a lower timeframe such as 4-hours or hourly. A rally to the downtrend on low volume could provide another opportunity to sell.
Silver
Daily:
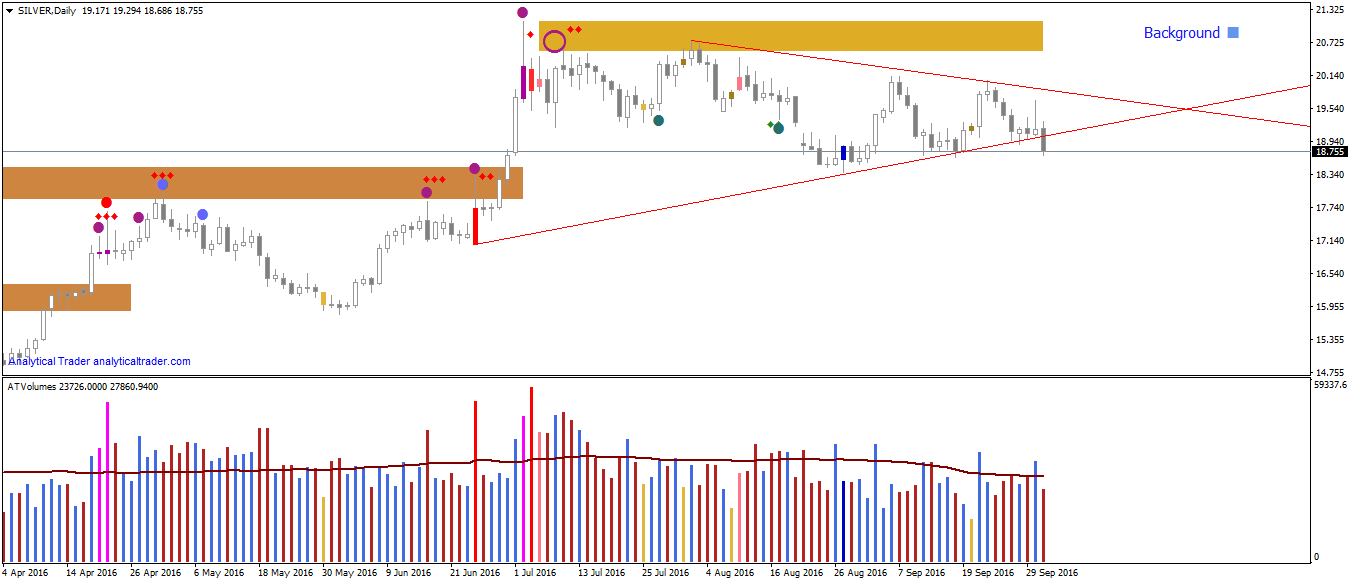
Silver is in a similar phase to gold’s, albeit its downtrend is clearer. An up trendline was just broken, and so, it’s good to check a lower timeframe to see the recent action in more detail.
4 Hours:
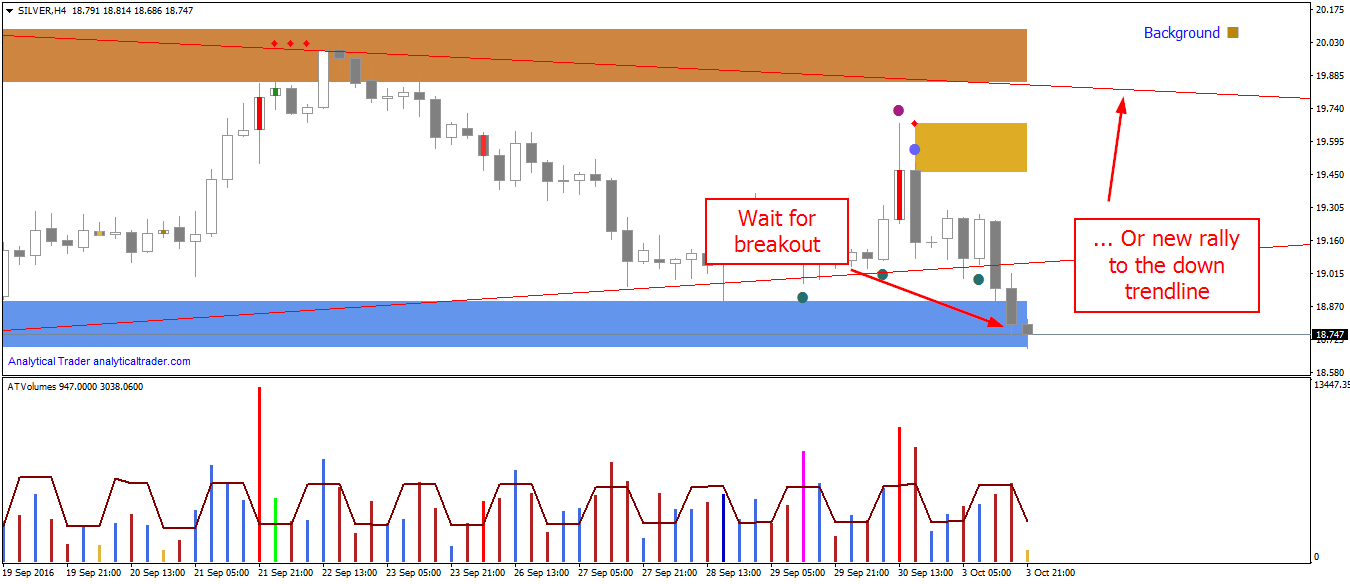
Silver H4 Chart
Prices are now approaching a congestion zone, and a breakout would give a short opportunity. In the daily timeframe, a pullback to the trendline could provide another opportunity to short.
In the daily and H4 timeframes we’ve spotted a distribution phase which can give short opportunities when there is a breakout confirmation. Until the market tells otherwise, I maintain a bearish outlook on the mid-term for precious metals.
Before Wednesday’s FOMC statement, USDCAD started showing supply signs above a strong zone. On the FOMC’s statement release, there was a rally, but the prices quickly tumbled, forming what we call an ‘upthrust’, on very high volume. This is what we know to be of a good breakout sign, and breakouts can be traded when it occurs.
The trade was closed after a VSA demand signal from H4, with a narrow range bar behind already showing demand coming in the market.
Right now, the market is approaching the previous zone at 1.315, and we can see VSA showing further supply, with the background still being weak. If the line drawn at 1.311 is broken (which coincides with the latest low), it’s a good confirmation to short the market. As of now, the market is rallying, and it will still have to prove the recent supply is enough to start a major turn. Other way to confirm it, is to wait for the dynamic trend to turn down.

USDCAD Trading Breakout
Dynamic trend: Turned down
Background: W1 – weak; D1 – weak
Phase: Markdown


In point 1 there was a “No Result from Effort” bar. It’s a combination of two bars, where there is an initial rally without a follow-up. Relatively low volume indicates that there were a small number of buyers.
In point 2 there was an “Up-Thrust” with a very wide spread and very high volume. The next down-bar confirmed bearish interest of the Smart Money.
In point 3 there was “No Demand” with a very low volume and very narrow spreads. Additional factors of weakness of the market was to be found in the lowering market. This was an excellent point for sell.
On TF M5 in point 1 there was “No Demand ” and was a great place for sell.
Suggested Strategies
Consider only sell if the prices approach to the level of 1.12 and «No Demand» bar will appear. Also I’ll sell when the price breakdown the level 1.1145 and «No Demand» bar will appear.
You can search «No Demand» and «No Supply» on the lower TF.
Dynamic trend: Turned down
Background: W1 – weak; D1 – weak
Phase: Accumulation

In point 1 there was a combination of two mixed bars. The first – “Shakeout”, with a relatively high volume compared to the last 40 bars; the spread was wide, all of which can be regarded as the accumulation by the Smart Money. The second bar was an up-bar with a wide spread and very high volume which showed supply, since prices didn’t continue to rally.
Further prices decreased, but on declining volume, indicating a lack of interest in lower prices by professionals.
In point 2 there was a “Shakeout”. The volume was significantly lower compared to point 1, which indicates the reduction of the number of sellers.
In point 3 there was the combination of the two bars, which together can be considered as a “Test”. The volume was relatively low. The next bar was an up-bar, which was a confirmation of the success of the “Test.”
In this situation, it’s recommend to refrain from deals due to the mixed signals. If there is a further down movement on low volume to the 101.900 level, there should be a long opportunity with the target on the trendline. The lowest support is at 101.500.

GBPUSD Breakout
In the last post, I noted there was strength behind that had been sustaining the prices, but further confirmation was needed to enter in a trade. In GBPUSD, the confirmation was the weak congestion zone being broken, but as prices were approaching it, there was some supply shown by a weak congestion bar. The reaction rally was on low volume, showing there wasn’t enough ‘gas’ to break the resistance. On the London session, prices broke out the lower zone at 1.316 and the support at 1.313 in the same hour, on very high volume, which was the definite confirmation of a bearish movement ahead.

In the 15-minutes timeframe, the volume spike at the breakout usually signals further down movement ahead
While this market sell-off goes on, there isn’t much that can be done; there should be a consolidation or a price rally to start planning a trade in GBPUSD in the intraday charts.
The Pound has been showing strength in the volumes lately, on the major pairs, with congestions showing a demand zone being formed at these prices.
GBPUSD
In GBPUSD the prices just bounced off the demand zone, which were the first long signal, due to the strength behind. The target is at 1.326, from where a breakout can be traded on a lower timeframe. Alternatively, if there is a correction onto 1.319 on low volume, there can be another long opportunity.

EURGBP
EURGBP is showing some selling behind, which is good for the GBP. A trendline break would give a trend changing confirmation, for a short trade.

VSA + Congestions EURGBP
GBPJPY
GBPJPY is ranging for a longer time than GBPUSD, and didn’t go down as much as GBPUSD did recently. There is buying behind showed by VSA and congestion bars, along with a strong congestion zone. The plan is to look for a trendline break.


