
Tomorrow, on 8th November, the US presidential elections begin. Up until now, the dispute on the presidential race between Hillary Clinton and Donald Trump has been a fierce battle. The polls have been mostly in favor of Hillary, although Trump has been gaining terrain in the last 3 months. Three months ago, Hillary had an advantage, in average, of +8pts ahead of Trump in the polls, but mostly due to Clinton’s scandal with the confidential emails which involved an FBI investigation, Clinton now leads Trump by just 3 points. On some polls such as LA Times/USC Tracking, Trump is the leader (+5 pts), and in Gravis, Hillary and Trump are tied. So, everything is still possible, and if there’s one thing that Brexit taught us traders, was not to rush to conclusions too soon.
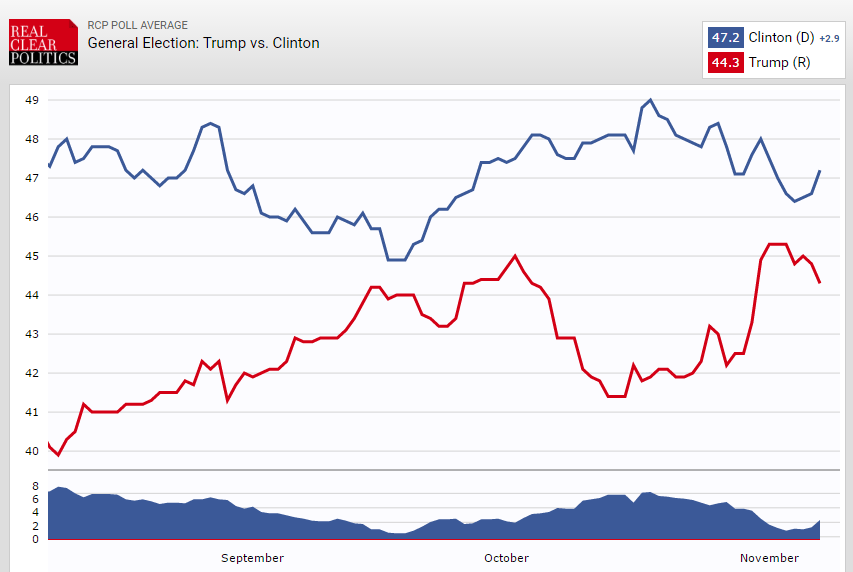
Clinton vs Trump Polls
What are the effects in the Forex markets?
This is a unique presidential race – Donald Trump is a man with many diverging ideas from the mainstream Republican ideology, such as on protectionism, foreign policy, and immigration policies, and so, the latest presidential races (such as George W. Bush election) aren’t a reliable indicator of what’s going to happen to the markets if the Republican candidate wins this one. Personal opinions aside, what everyone can agree on is that if Trump wins, he would bring quite some changes and unpredictability, at least at the beginning, to US politics and economy. Unpredictability brings volatility, and that’s what we can expect on a Trump’s victory. US Dollar would fall sharply, due to an expectation of a capital flight out of US Dollars to safe-haven commodities and currencies, such as gold and the yen respectively.
Clinton, on the other hand, is a more predictable candidate, and the markets know what to expect from her presidency if she wins. US Dollar will be strengthened since the unpredictableness from the elections will be gone, and safe-haven currencies and commodities (Yen and gold), would weaken for the same reason. The movements are skewed, though – a Trump win would give rise to extreme movements, while Clinton’s victory would mean more moderate movements. The table below resumes these effects:

Clinton vs Trump – Effects in the markets
A way to approach these elections could be to bet for a Trump’s win, as his win would move the markets more sharply than Clinton’s win (and hence, would give a favorable risk to reward), but since his election probability is also lower due to the polls results, it would certainly be a very risky shot. The wisest thing to do is to stay out of these assets until the votes are counted, as a period of high volatility is to be expected during the voting day, and after the candidate is chosen.
Dynamic trend: Turned down
Background: W1 – weak; D1 – weak
Phase: Markup
Support: 1.100
Resistance: 1.106

EURUSD Hourly
HOURLY
In point 1 there was an up bar, that looked like a “Shakeout”, with a very high volume and an average range. This is a pattern that shows demand, and on a critical point, approaching the weak congestion zone ahead.
In point 2 there was the resumption of buying after prolonged shaking out on a downward trend.
15 MINUTES

EURUSD 15 Minutes
On TF M15 in point 1 there was a “No Supply” bar after signs of strength and resumption of the uptrend. This was a good point for a long position.
Suggested Strategies
Consider buying if the price breaks out the level 1.106 and «No Supply» appears (down bar with a narrow range and a low volume). Also consider buying if the price moves down to the support level 1.1, there is a sign of strength and «No Supply» appears. Consider selling if the price breaks down the level 1.1 and «No Demand» appears (up-bar with a narrow range and a low volume).
You can search for «No Demand» and «No Supply» on the lower TF.
Dynamic trend: Turned up
Background: W1 – weak; D1 – strong
Phase: Accumulation

USDJPY Trading Range
Since the previous analysis, the price continues to remain in the trading range 103.17 – 104.30, with congestion zones formed in between.
Point 1 was the breakup up-bar of a strong congestion zone. In the 15 minutes timeframe, there were also clear signs of a bullish movement.
In point 2 there were a series of up-bars with a very high volume. Usually up-bars with a high volume and a wide spread are signs of weakness, but the weakness revealed here was tested in point 3.
In point 3 there was a “Shakeout” with an average spread and a low volume, which can also be regarded as a successful test, indicating «No Supply». We should expect further upward price movement.
Suggested Strategies
I recommend buying near the support level of 103.17 after the appearance of significant signs of strength, the beginning of an upward price movement or the appearance of “No Supply”. However, if prices continue to rally, a break-out of the 104.2 level would confirm the buying (accumulation) seen behind. For the time being, prices are just below a weak congestion zone, and it’ll be better to stay in the sidelines, in the hourly timeframe.
In last week’s post about EURUSD, I wrote that you should look for shorts in a rally to the 1.11 level, as the downtrend didn’t seem yet finished. Prices got halfway there, with the volumes showed lack of demand near that temporary top.
Dynamic trend: Turned up
Background: W1 – weak; D1 – weak
Phase: Markdown

In point 1 there was “Stopping volume” with a wide range and with a very high volume (the highest in the last 166 bars, since the beginning of a downtrend). Taking into account the previous price movement, this volume is likely to be insufficient for a full trend reversal, though we can’t exclude a short-term uptrend.
Suggested Strategies
Consider selling if the price breaks down the level 1.0962 and «No Demand» appears (up-bar with a narrow range and a low volume). Also consider buying if the price breaks-out the level 1.1 and «No Supply» appears (down-bar with a narrow range and a low volume).
You can search for «No Demand» and «No Supply» on the lower TF.
Dynamic trend: Turned down
Background: W1 – weak; D1 – weak
Phase: Markdown

EURUSD H1 Chart
In point 1 there were a series of up-bars with a wide spread and high volume. This bullish maneuver is a «Potential Buying Climax». The two subsequent down bars confirmed the supply, therefore also confirming the weak congestion zone.
In point 2 there were a series of up-bars «No Demand». These have a special significance, because they were near the bar high of the point 1, and they were inside the weak congestion zone (the zone of previous selling). A good place for a short position.
In point 3 there were a series of up-bars ” No Demand ” with subsequent down-bar and “Up-Thrust” with low volume. Due to the weakness behind, one should look for a breakout of the congestion zone.
Suggested Strategies
Wait for a rally to 1.11 to consider shorting, if there is either more supply or no-demand bars.
Tomorrow at 1:30pm BST the NFP and unemployment numbers are being released, which could provide the breakout of critical levels in USD pairs, such as in USD/Yen.
Hourly Timeframe

USD/YEN Hourly – Trend and Resistance
In the hourly, USDJPY is on a clear up trend, within a channel, and approaching the important resistance at 104.32. The market has been rising on high volumes, and the current supply is normal in overhead zones such as this one. Depending on the NFP numbers, the breakout could go either way, and both are trade-able.
- In case the up trendline breaks, you should go to a lower timeframe such as M15 to trade it, as the movement might not be so prolonged without further rallies and tests.
- In case there is a breakout to the upside, it should be traded on H4 since it’s a trade to be held for the mid-term.
4-Hours Timeframe

Before NFP USDJPY 4H
On the 4 hours timeframe, we can see the prices are actually on a selling congestion zone, which reinforces the plan idea that there should be a breakout to trade it.

