
On the previous week post about the Yen, we noticed that there was consistent buying in the hourly chart, and that a dip into the lower part of the range would give a long opportunity. This happened, and right in the next London session!
On trading ranges showing VSA buying signals, like we note on the trading guide, you can also wait for a breakout of the trading’s range high. If on the break, the volumes pick up, it’ll be a confirmation of accumulation. This is what happened in USDJPY, and since then, it has been on a long rally, until stopping on a long-term trendline.
Apart from the down trendline, the momentum of the uptrend is now fading, and there is significant supply showing up. This is inevitable on resistance areas, but still, if you’re holding a long in intraday, this is a good time to start reducing the position size, and wait for a trendline break to add into. Personally I’m holding a long daily trade, and waiting to see how the daily bar closes.
If the trendline is broken, it’ll be a long/adding signal. If supply keeps showing up on the hourly, and/or there are low volume rallies into the current selling bar, it’ll be a short signal.

The Pound went through a sell-off in the last days, after testing a resistance at 1.471. The volumes showed supply through May when attempting to rally to the 1.4700 area, but the prices held on below it, with only minor shake-out attempts. Even though there was an up trendline, which shows the long-term trend, a trend can always change, and that’s usually the case when there is professional selling over an extended period of time.
The trade was taken on early London session on the reaction rally, where more sluggish action was seen, and the take-profit set above the nearby trendline.

Resistance Fake Breakthrough
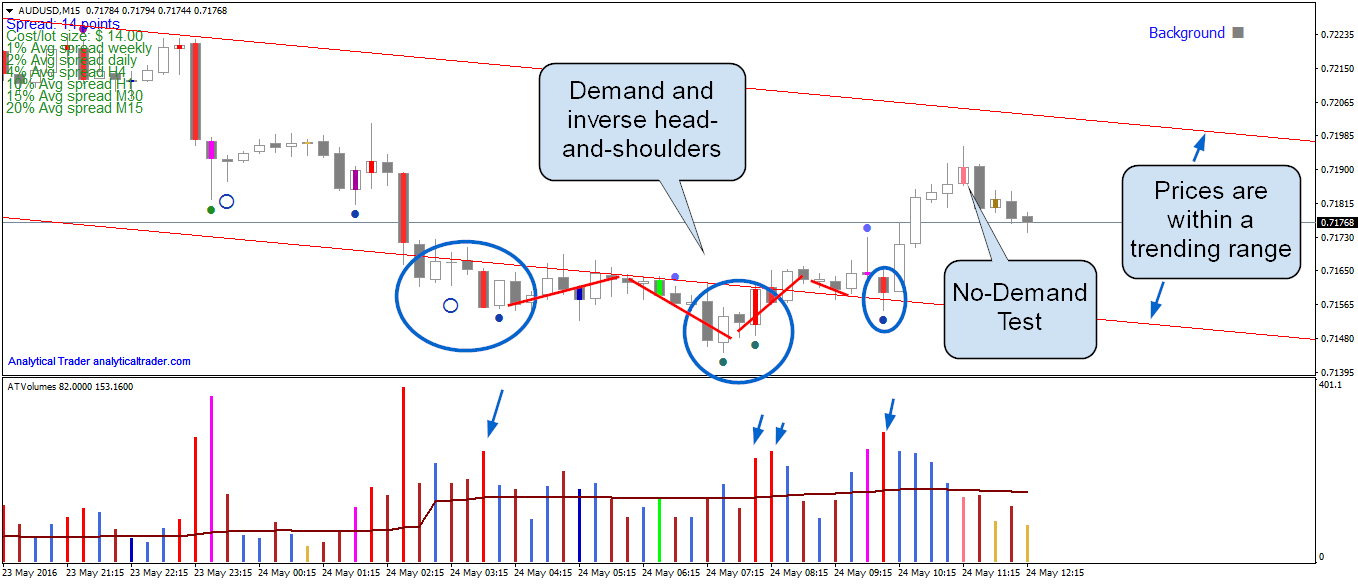
AUDUSD on the 15 minutes timeframe, is showing significant buying at nearby prices, with an inverse head-and-shoulders price pattern. This price pattern is characterized by 3 bottoms, and unlike many other unreliable price patterns, this one has actually a sound logic behind it: the first bottom is met with buying, and so the down move is halted. On the 2nd bottom, the lowest of the three, the market is shaken-out by being taken to new low ground, setting off stop-losses and triggering shorts on break-out traders. The market then reverses on professional buying using the ‘discounted’ prices, and then it still goes down one more time for some more buying, or just for supply testing. Though, using the prices alone isn’t enough, the volumes give useful information which should also be incorporated. In this case, VSA showed demand on the 3 bottoms, until the very last bar where the pattern’s high was broken.
On the last high, AUDUSD showed a no-demand test (testing higher prices for demand orders), which was met by a sudden down move, confirming the lack of demand. For an up move to continue, I expect prices to come closer to the lower part of the trending channel first.
Daily
For the past months, Euro/Yen has seen buying between 121.00 – 124.50, shown by the multiple strong signals at this area, and the high volumes at the bottom. It’s a quite loose accumulation pattern, since the market made a lower low at mid April (point 2) than the first bottom at February/2016 (point 1), along with the very significant selling seen on the lower timeframes, on the last rally (point 3). There is also a down trendline nearby, and due to these reasons, I’d be more inclined to trade a break-out of it on a lower timeframe such as H4, where it’ll be easier to manage the trade for a faster exit.

4 Hours
In the 4-hours timeframe, in point 1 VSA marked the bar as Major Supply, and as Supply using multi-timeframe analysis (showing as a circle). In this lower timeframe the most recent buying can be more easily seen, starting in point 2, where the arrows are pointing. Those are either high volume bars (red painted bars), which after a strong fall and price congestion, show demand in a more ‘disguised’ way than the VSA signals, and 2 VSA Demand signals. In point 3 there is another Demand signal, which is also a churn.
It’ll be valuable to see if there is a break-out of the trendline for a long trade, and to be alert for supply signals in the zone of previous supply, painted as the red rectangle. At 24/May (Tuesday) German ZEW Economic Sentiment is being announced, which if positive, could provide a price boost towards 124.670.

In this trade a long was taken at the strong VSA signal, though there was distribution behind. This is seen by the multiple Major Supply signals, with the prices not advancing further. A bit after, there was an upthrust bar (pink bar), showing more supply, and a successful no-demand test (light pink bar).
In the entry point there was some buying, though it wasn’t enough to stop the trend. The buy-stop should also have been set above this bar’s high (https://www.analyticaltrader.com/trading-guide/vsa-trading-setups/trend-trading/supplydemand-background/), which comes as a price confirmation of strength.

After breaking the down trendline mentioned in our latest analysis post, AUDJPY started a healthy uptrend. On the 80.500-80.600 level high volume without any price progress was seen, and on a news event it went down on a wide range, in the 15 minutes timeframe. On a reaction to this down move, while the background was weak, a down reversal appeared (on sensitivity 4, which has the best Rating on this pair/timeframe), where the short was taken. A Minor Supply Signal confirmed the weakness on this reaction. The stop-loss was set above the previous high, and the take-profit near the up trendline, for a +29 pips move.


