
NZDUSD broke out an old high at 0.705 last week. Since then, it has been showing weak action seen by the stalling prices and high volume, and today, a low volume rally to the breakout’s price. Until something changes, I’m assuming the smart money isn’t interested in higher prices given the past action. FOMC is making a press conference today at 6pm GMT, and tomorrow at 12:30am GMT, US Unemployment claims and CPI reports are being released. Between the two, there might be an opportunity to trade NZDUSD on a small timeframe, such as M15, especially if FOMC press conference is bearish for the Dollar, which would make the prices more attractive to short.

AUD Update
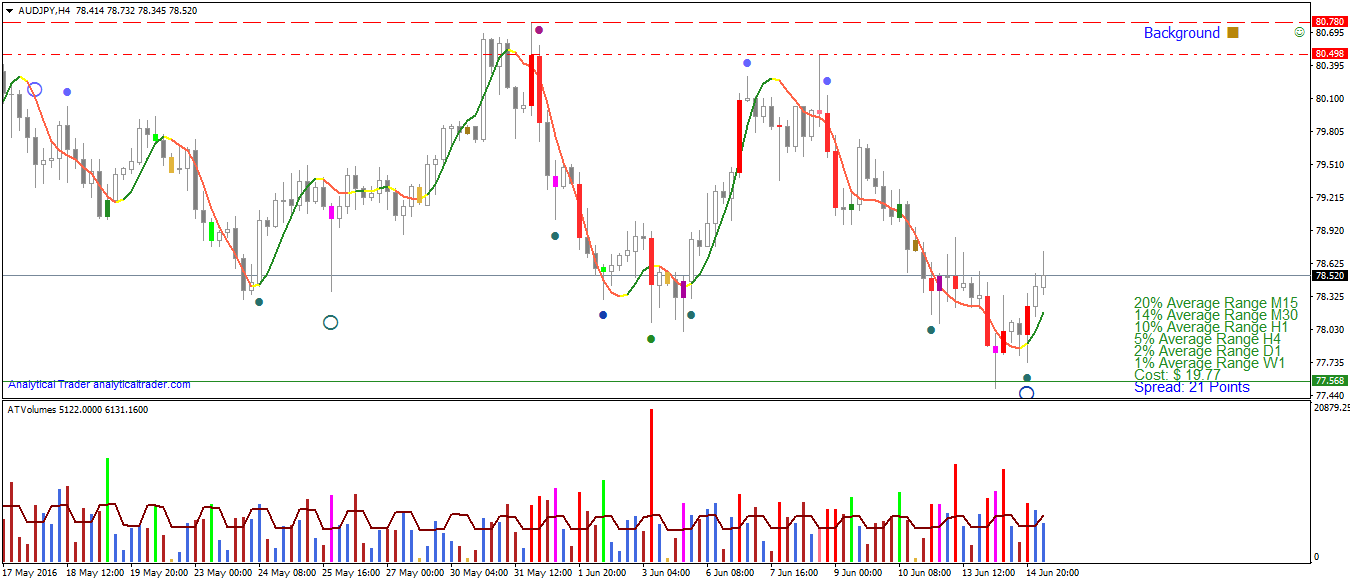
In the last post, I analyzed AUDUSD and AUDJPY. In AUDUSD I noted that a correction would be necessary after such a movement, and would provide a buying opportunity. It showed up last night at midnight GMT in H4. More opportunities might show up today if there is a reaction to the downside. AUDJPY bounced off a previous low on high volume, meaning there was a shake-out in the market (stop hunting). Likewise, a down reaction can provide another buying opportunity.

AUD Pairs are undergoing a correction for the past few days. Boosted by FOMC on the past Friday, AUD/USD broke the down trendline that was in place since April, on furious volume, which is often a good indication of strength in critical areas. Reaching higher ground, the volumes showed some supply – first a churn (narrow range bar with high volume) and an upthrust (bar to trigger more buying and short stop-losses). After such a strong movement, a correction is the market taking a breath, and it can provide more trading opportunities. This correction has given yet no signs of stopping, and I expect a resistance to be found near the break-out’s bar, where many large traders went in on the market, which is where I’ll be looking for a price reversal.

AUD/JPY
This pairs looks more interesting than AUD/USD to trade on the short-term. Last week there was a shake-out of the 78.43 support, which likely triggered many stop-losses and sell-stops, that provided liquidity for institutional traders to buy it, and reverse the prices. The buying is there, but are there still many sellers at these prices? To know that, we have to pay attention to the volumes and price ranges – narrow ranged bars or low volume ones would show that the reaction is going to stop, and that we’ll see higher prices.

EURUSD Daily

After the negative numbers on NFP last Friday, EURUSD fired up on massive volume, and is now getting to the point of previous distribution. A lower timeframe will show the recent picture more clearly.
EURUSD H4

On H4 we see that there is some supply at this price level, but with the massive buying on NFP that took place, I expect major players to be still supporting an up move, until they can sell more of their positions – there is still room on the upside to go.

AUDUSD H1 Volume Trading
Following the inverse head-and-shoulders with buying volumes on the bottoms (point 1), seen in M15 and mentioned in the previous post, AUDUSD reached more attractive prices for buying and resumed its rally. Upon reaching a resistance level (down trendline) at point 2, volumes showed supply swamped demand, and the market reversed. Reversals also confirmed the second one, at the highest rating sensitivity. It’s an indicator that can be used for confirming VSA signals, or to show additional likely reversal points, like the one on the bottom at point 1.
Prices then followed the down trendline, and reversed at point 3, where VSA marked a Demand signal and a thrust bar. After 2 more supply signals showing up, at point 4 the trend was again stopped. This is often the case that the market oscillates between VSA signals, and shows the importance of correctly following the volume in trading, even if relative volume as in Forex.
After the supply shown at 4, the reaction was a frail rally with low volumes, which showed no interest by large players in an up move. In the last hours, another thrust bar appeared (pink bar), which is a common occurrence where uninformed traders go long, and that liquidity is used to dump sell positions and thus bringing the market lower very rapidly during the same hour.
Looking at the big picture, AUDUSD H1 is the middle of a trading range and on a small sell-off, so it’s risky to take any position in the hourly just yet. Prices should reach Gold, a commodity that is tightly related to the Australian Dollar, has just reached a very important support located at $1209. There was a no-supply test bar at H4 which seems to have been unsuccessful, as there was no upward reaction, and so lower prices are to be expected, perhaps a shake-out of the area.
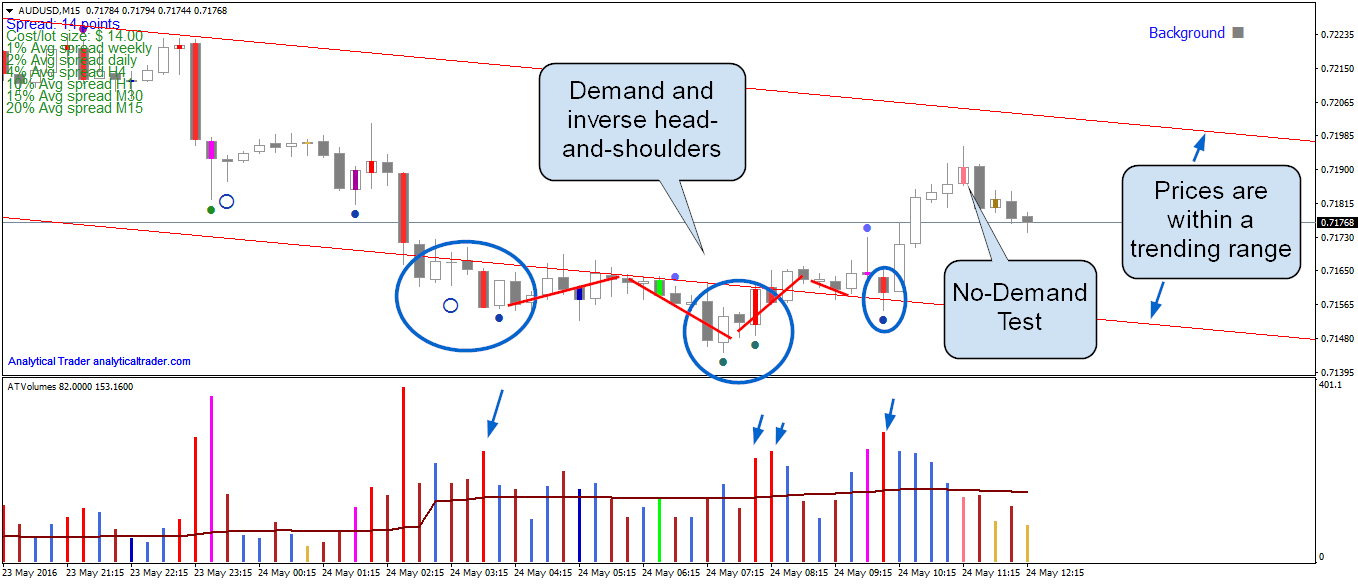
AUDUSD on the 15 minutes timeframe, is showing significant buying at nearby prices, with an inverse head-and-shoulders price pattern. This price pattern is characterized by 3 bottoms, and unlike many other unreliable price patterns, this one has actually a sound logic behind it: the first bottom is met with buying, and so the down move is halted. On the 2nd bottom, the lowest of the three, the market is shaken-out by being taken to new low ground, setting off stop-losses and triggering shorts on break-out traders. The market then reverses on professional buying using the ‘discounted’ prices, and then it still goes down one more time for some more buying, or just for supply testing. Though, using the prices alone isn’t enough, the volumes give useful information which should also be incorporated. In this case, VSA showed demand on the 3 bottoms, until the very last bar where the pattern’s high was broken.
On the last high, AUDUSD showed a no-demand test (testing higher prices for demand orders), which was met by a sudden down move, confirming the lack of demand. For an up move to continue, I expect prices to come closer to the lower part of the trending channel first.
Daily
For the past months, Euro/Yen has seen buying between 121.00 – 124.50, shown by the multiple strong signals at this area, and the high volumes at the bottom. It’s a quite loose accumulation pattern, since the market made a lower low at mid April (point 2) than the first bottom at February/2016 (point 1), along with the very significant selling seen on the lower timeframes, on the last rally (point 3). There is also a down trendline nearby, and due to these reasons, I’d be more inclined to trade a break-out of it on a lower timeframe such as H4, where it’ll be easier to manage the trade for a faster exit.

4 Hours
In the 4-hours timeframe, in point 1 VSA marked the bar as Major Supply, and as Supply using multi-timeframe analysis (showing as a circle). In this lower timeframe the most recent buying can be more easily seen, starting in point 2, where the arrows are pointing. Those are either high volume bars (red painted bars), which after a strong fall and price congestion, show demand in a more ‘disguised’ way than the VSA signals, and 2 VSA Demand signals. In point 3 there is another Demand signal, which is also a churn.
It’ll be valuable to see if there is a break-out of the trendline for a long trade, and to be alert for supply signals in the zone of previous supply, painted as the red rectangle. At 24/May (Tuesday) German ZEW Economic Sentiment is being announced, which if positive, could provide a price boost towards 124.670.


