
Dynamic trend: Turned down
Background: W1 – weak; D1 – weak
Phase: Mark down

EURUSD Markdown
In point 1 the bearish signal is a top reversal. Volume is very high. VSA showed major supply.
In point 2 – «No Demand», which confirms the weakness in point 1.
In point 3 – «Up‐thrust » with normal volume and wide spread. In this case such volume and spread means that supply has overcome demand.
In point 4 – breakout. The next bar confirmed the breakout.
If prices get back to area 1.10 and no demand appears (such as low volume up bars, or VSA no demand signal), I’ll consider taking a short in this area of previous weakness.
Without looking at the volumes, it would be hard to notice anything different from any other session close volatility. But analyzing the volume would show in this case, that there was a market shake-out – a sudden down movement, closing on the middle/high of the bar, with very high activity. This is one professional buying pattern that usually knocks the market off instantly, and gives opportunity for low risk trades. When there was a bullish test (blue bar), a bar that tests the supply in the market, I entered when its high was broken, which was the confirmation of no supply. More demand showed up afterwards, and soon the target was hit.
Right now, the market is going up to the zone of previous supply on low volumes (even for the Tokyo session), so another dip down to the 1.315 area is possible. If volumes are kept low, this would give another long entry opportunity.

Entering on Supply Test GBPUSD
Since Brexit, gold, silver, and related currencies (comdolls) such as AUD, have been on the rise, due to gold’s status as a safe-haven commodity. Since a few days back however, things have started to change, and big sell orders have started hitting those markets.
Gold
In H1, VSA showed a Major Supply signal, which knocked off the market into a sideways range. A few more supply signals have been showing since then. The prices formation, together with the volumes, form a congestion zone, which is the red rectangle (from the soon-to-be-released indicator). These are zones where the price usually stales, and this is a good example. A breakout of the congestion zone to either side will give more indications of what’s to come. I’m more inclined to take a short if the up trendline breaks, as any upside breakout will most likely be short-lived.

Silver
Silver has already topped, also on Major Supply, and as of now, the prices have went down a bit too far to go short. In this commodity, more supply or low volume up bars above $20.15 will give another opportunity to go short.
AUD/USD
While gold and silver prices were stalling, this pair led the way, and made a serious downturn. It’s now getting near the long-term up trendline, which may provide some short-term support. In this chart it’s also important to note the congestion zone, due to the shake-out a few bars before the start of the rectangle. These are zones where there were previous big buyers in the market, and unless they have sold their positions in the meantime, they will keep buying and support the prices.

On Brexit’s leave decision, EURUSD went down as was expected, fueled by the fear of an economic downturn in the Eurozone. I consider the reaction, 4% less value when trading Euros for Dollars, was somewhat exaggerated however; if Brexit is to have a negative effect on the economy, it will be on the medium/long-term, as the process of UK leaving the EU will be slow, and the trade deals between EU and UK are still in place. As to what institutional traders are doing – they bought heavily by the end of the voting day. This is seen by a close well of the lows, and the very high volume, which surely wasn’t just by retail trading. This consolidation may be slow however, and I expect prices to come further down before a significant rally.
Low volume down bars or test-like bars would show there is no significant supply in EURUSD anymore, and an up Reversal while the long-term trend (Dynamic Trend) is up would provide a long entry opportunity.

As the voting for the Brexit continues, many investors are trying to figure out what’s going to happen, and what the consequences of the voting will be. Markets have been assuming Great Britain will remain in the EU, seen by the significant rises in GBP value compared to other currencies, and betting websites such as Betfair, have their odds significantly in favor of “Remain”. There are 4 hours to go until voting polls close, and for us to know the preliminary results. The polls were technically tied just yesterday, and so either result is possible. In the below table, you can find a resume on the consequences of a Brexit or remain.
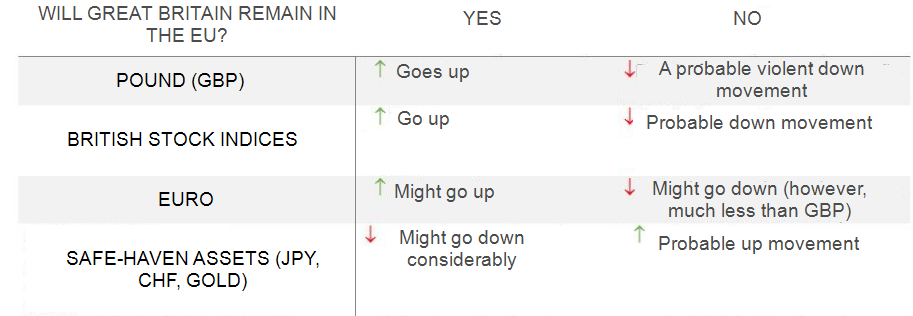
The analysis on the major pairs made yesterday, 20th June, can be seen on investing.com, here: http://www.investing.com/analysis/analysis-to-the-major-pairs-200137132. This post below is an update on that analysis.
EURUSD
Since yesterday, EURUSD went further down and closed the gap, after a rally attempt on low volumes, relative to the Tokyo’s session. I maintain my view that a test/low volume bars on this area, and on prices closer to the trendline, will provide an opportunity to go long.

GBPUSD
This pair has been stalling on the breakout’s price, and showed supply in the form of an upthrust – it’s a bar making a higher high than the previous ones, shaking-out longs from the market. I doubt that selling will have a prolonged effect on the market however, and a correction of this extended move may still give an opportunity to go long.

USDJPY
Out of the 4 pairs, this is the one with the most interesting development in my opinion. The trendline is now being broken, but the volumes are very low, which show lack of demand. After such demand before, I would expect more buying for a true up movement to happen. If the volumes pick up on this area, or more VSA signals appear, I expect USDJPY to start a more significant up movement.

USDCHF
This pair is on the lower part of the congestion area. The last bar was a test – its low was close to the congestion’s lows, and yet, selling didn’t pick up; it closed on the highs, with a low volume. Just as I’m writing this post, the prices are struggling to rally after this supposedly strong indication, which shows there is no particular interest in an up move for now (we call it a failed test).


