
In yesterday’s post, we analyzed 3 pairs that could be headed to take a hit: USD/CHF, EUR/GBP, EUR/JPY. However, both EUR/GBP and EUR/JPY dried up on volumes, and they didn’t reach the target levels. The confirmation as a break of a low volume bar / SR level is especially important when the background is neutral/adverse.
In USD/CHF, we were looking for a possible LONG position reaching the trendline/support at 0.969.
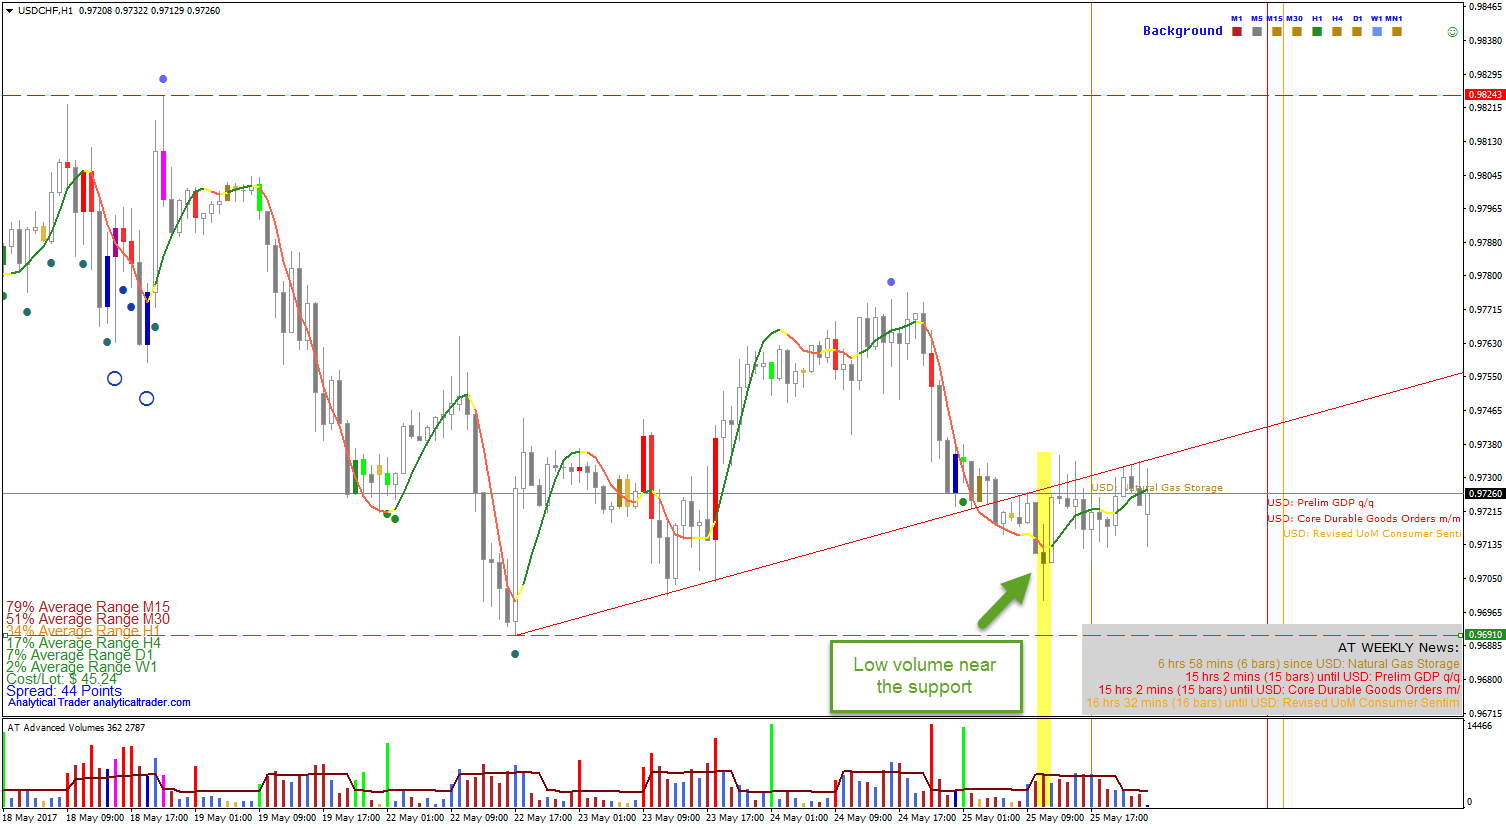
In the chart we can see that there were low volumes near the support, giving a confirmation for a LONG trade during the London session. And why? This is because there is plenty of buying at this level, so any low volume bar is showing lack of supply in a critical zone.
As the New York trading session closes, we found 3 potential trading opportunities to follow and possibly trade during the Tokyo session or tomorrow’s London. These opportunities are in USD/CHF, EUR/GBP, and EUR/JPY. Below you can check the current market background, short-term trend and nearest supports/resistances for each pair. As always, we are using VSA, and associated indicators, for a supply/demand view of the market.
Read the 25/May Update here: https://www.analyticaltrader.com/market-update-final-remark-on-ny-closing-session/
USD/CHF M30
Background: Weak
Short-term trend: Down
Support: 0.9691
Resistance: 0.98243

This is a pair to observe in case it rebounds after touching the upwards trendline. The market is currently in a downward sloping trend with low volume, showing a lack of supply to further continue the trend. If the trend rebounds and breaks the previous bar high near the 0.9705 level on high volume, we may be heading for a rally in the late Tokyo/early London session. Traders should look for low volume near the trendline and a fast price movement as prices break the already mentioned level.
EUR/GBP M30
Background: Neutral
Short-term trend: Down
Resistance: 0.86743

In this case, we see a short-term uptrend that seems now to be starting a reversion. There were already many weak VSA signals in the current and above timeframes and the trend is now down. If it breaks the most recent trendline, may look for a SHORT position on high volume showing strong supply. This may constitute a good trading opportunity to open a short position since there is no strong support nearby.
EUR/JPY M30
Background: Neutral
Short-term trend: Down
Resistance: 125.288
Support: 124.552

EUR/JPY may be a good trading opportunity even before the opening of the Tokyo Session. The trend failed to break the near resistance and bounced back. We’re now at a crucial zone where the market has been trading sideways. If prices continue the downward trend, there may be room for a SHORT position with a take-profit near the mid-term support. There has been distribution recently and the high volume bar denotes supply near the resistance
Volume spread analysis is a school of thought that believes volume plays a crucial role in understanding moves of prices in financial markets. This text will highlight 5 core arguments that solidify this basic premise.

Volume Spread Analysis
1- Technical analysis is not enough.
An argument in favor of technical analysis is the idea that the securities’ prices may not be linked to their fundamentals. The behavior of financial markets is frequently a result of momentum, confidence, and sentiment. In this sense, traders analyze security price chart to know what is the upside and downside potential.
However, reading the market solely from prices is insufficient. Markets move on supply and demand, and so, volumes are also an important part of the equation.
Volume Spread Analysis is a good way to understand how the concepts of supply and demand influence prices. It allows spotting imbalances between buyers and sellers by looking at prices and volumes.
VSA helps traders understand what the major players are doing and benefit from their actions. When a small trader buys or sells a pair, he/she certainly will not influence the price. However, when a big bank trades millions of a certain currency, this will probably move the market up or down. Usually, these big traders have more information and knowledge about the markets, so it is wise to be on their side. Through volume analysis, traders can know if market makers are buying or selling and take advantage of their positions.
2- It’s all about perceived value.
Fundamental analysis states that we can always grasp the intrinsic value of a financial instrument – stocks, currencies, commodities, etc. An assessment of the economy would allow traders to explain oscillations in prices.
On the contrary, volume-based traders say that to fully know what goes on in the markets, we should rely on perceived values instead of intrinsic value. And what does perceived value mean? This is how different professional traders view a financial instrument. And this is always contextual and acquired through an analysis of volume.
Below you can find the evolution of the price to book value since 2000 of the S&P 500. This metric is considered an approximation of the perceived value. It’s possible to see how traders permanently evaluate companies above their book value, taking in mind other analysis besides the fundamental one.

3- Price and volume are inter-related.
Past prices are an important aspect to understand moves in financial markets. However, the analysis of price is not enough.
A lot of technical analysis theories say we can solely rely on the analysis of price to understand the next move. These can take the form of different theories: Dow theory, Elliot wave theory, harmonic theory, candle-based trade, etc. The bottom line for all these traders is that everything is reflected in prices and different patterns.
Volume spread analysts say that the analysis of price is incomplete. We need to understand where the money is and where it will be in the future. Only then we can try to predict what is going to happen in the markets.
4- The cause of moves is volume.
We already dismissed fundamental and technical analysis as the sole explanations for moves in financial markets. Now, let’s look at how volume spread analysts justify these moves.
In their opinion, we need to look at prices in relation to volume. It is only this interconnection between price action and volume that justifies moves in financial markets.
In the chart below you can observe how major moves in prices or price reversions were always accompanied by volumes higher than normal. An analysis of volume in this situation would help traders identify these movements of prices.

Relation between price movements and higher trading volumes
5 – It’s all about understanding the role of different traders in the market.
The 5th core idea is that different kinds of traders carry different sorts of information – and we can base our trading strategy on this idea.
Volume spread analysis tends to emphasize three different types of traders: retail, commercial and professional. Retail traders are those who have small accounts and tend to trade erratically. They do not have any particular trading strategy and traditionally tend to buy and sell when the uptrend/downtrend is exhausted.
Commercial traders are investment banks whose function is to place orders in the market to satisfy clients’ needs. They can also function as market makers. These traders have an impact because they often carry large orders, which usually cause volatility. However, they don’t have any strong rationale supporting their trading decisions.
Professional traders are large traders that are in the game to win, and they are behind most trends. These are the types of traders that volume spread analysis tends to be concerned with – the successful volume trader is the one that detects what these traders are doing.
The following chart illustrates the power of large traders in moving the markets. On the left side, large traders reduced their positions, which caused a downside movement in prices. Prices traded sideways while these traders had stable positions and, when they started buying, prices moved upside. A small trader aware of what large traders were doing could follow their steps and take advantage of this information.

COT Report Large Traders
The ultimate goal in trading is to have the highest return for the minimum level of risk. Money management is the calculation of risk and reward in any trade, to maximize efficiency. In this article, we explain why money management in Forex trading is truly important to improve your results and what strategies you can adopt. Find out why it’s important to know your risk profile and how you can manage risk vs reward accordingly.
Money Management – The Basics
Every trader is different. As such, the way different traders manage their accounts will vary a lot. However, independently of the type of trader, there are some common principles of money management in Forex trading that apply in every situation.
- Determine how risky is the trade – This one is especially important for risk-averse traders, but also apply to others. Before opening a position, you should always evaluate what are the risks involved. You don’t want to lose all your account in just one trade, so always evaluate the worst case scenario first. There are some trades which are simply not worth the risk since the expected return is relatively low. These trades should be avoided.
- Determine how much risk are you willing to take – Once you assessed the risks of the trade, it’s time to decide if you are willing to take that risk. Some traders prefer to take larger risks in exchange for a higher return. Others prefer to have smaller but safer profits. Understand what type of trader you are, and develop a strategy according to that.
- Check the relation between risk and reward – Finally, after deciding if you are willing or not to bear a higher risk, you should see what’s the expected return for that level of risk. It’s not worth it to trade a pair which has the same reward as another pair but is riskier. Always choose the trade that offers the best risk-reward relationship.
Risk Profile
Many traders fail because they do not create a strategy according to their risk profile. When a risk-averse trader tries to use a more aggressive strategy, he will probably let his emotions control his actions. As explained in our article about trader’s mentality, this is because some traders are less willing to bear major drawdowns. They will probably end up closing their positions at the wrong time, which will make the strategy ineffective.
According to your risk profile, you should set up a maximum amount to each trade. In order to protect your capital, it’s highly recommended not to use more than 5% of your account in one single trade. This simple rule can be very helpful in case the trade goes against you. By risking only a maximum of 5%, you can be sure you’re not going to blow off your account in one single trade. Although the 5% is a standard measure, some traders may find it better to establish a lower percentage, like 1% or 2%, which is also fine.
To calculate these values, you can use the FXPro’s calculator. In Stop Loss Take Profit Amount, you can select the pair you want to trade and place the respective levels of Stop-Loss and Take-Profit. The calculator will automatically give you the Drawdown and the Profit according to the lot size.

Managing Risk and Reward
As already mentioned, an efficient trade is the one that maximizes reward to a certain level of risk. But how can you do this? In fact, there are some strategies worth noting to manage risk against reward.
Risk/Reward ratio
This is a widely known and used ratio to evaluate the relationship between the risk of a trade and its expected return. If you’re trading a pair which is at 0.9 and you place a stop-loss in 0.85, you’re risking 0.05. On the other hand, if you believe the pair is going to 1, your expected return would be 0.1. In this case, the risk/reward ratio is 0.05:0.1 = 1:2. This means that you can make a profit even if just you win more than 33% of the times!

Define your stop-loss before opening a position
Stop-losses are important to set a limit to your losses. The location of your stop-loss may vary according to the amount you’re willing to lose if the trade goes wrong. However, there are some simple techniques to define its location. Generally, stop-losses should be placed a little bit under the closer support. This will guarantee that it will only be triggered if there’s a breakout. If the trend touches the support and rebound, you will benefit from this reversion. You can also know more about the support/resistances indicator here and download it here.
Moving Stop-Loss
As mentioned above, it’s recommended to define a stop-loss before opening a position. However, to protect your capital while the trade is open, move the Stop-Loss as the trade goes on. If you already have a profit from an open trade, don’t risk to lose it all if the trend reverses. As the trend goes up, establish new SL levels closer to the current price, below the most recent short-term support. In this way, you won’t lose everything in case there is an abrupt reversion.
The Bottom Line
Any successful trader should be aware of how money management in Forex trading is essential to get better results. Traders should know what is their risk profile and define a strategy according to it. Compare the risk of a trade against the return to check its efficiency and guarantee the best reward. Ratios like the Risk/Reward are very useful to do this, as well as defining a Stop-Loss and move it during the trade.
The NFP is due in some hours, and we found 3 potential trading opportunities before and after the release, in NZD/USD, GBP/USD and USD/JPY. Below you can check the current market background, short-term trend and nearest supports/resistances for each pair. As always, we are using VSA, and associated indicators, for a supply/demand view of the market.
NZD/USD M15
Background: Strong
Short-term trend: Down
Support: 0.68500

NZD/USD may be a solid trading opportunity for a late Tokyo Session or early London. We’re approaching a major news announcement and, if NZD/USD retraces after the announcement, it may be a good buying opportunity near the long-term support at 0.68500. If prices touch the resistance and bounce back, traders may open a long position, which will be reinforced in case there are demand signals. Low volume bars during a downtrend near a resistance may also anticipate a trend reversion.
GBP/USD 1H
Background: Weak
Short-term trend: Neutral
Resistance: 1.29648
Support: 1.28631

In this case, we see a long-term downtrend and prices near the upper bound. After the news, in the case of GBP/USD appreciates and touches the trendline, it may be a good opportunity to short. This is because there was distribution before, and if NFP doesn’t change things radically, it could give a shot to trade GBP/USD.
USD/JPY 1H
Background: Strong
Short-term trend: Up

There are no supports, neither resistances nearby. However, we saw an uptrend that was broken with high volumes during the US session. News about US employment are due in a few hours and it will bring some volatility. In case prices approach the trend line from below, it may become a short opportunity. Look for low volume bars approaching the trendline.
The NFP will dictate what happens next, but by being alert to what’s happening now, we can better plan our trades.
Very few traders realize it, but bond spreads have an immense value when trading Forex on a daily/weekly basis. In this guide, we’ll show how you can use this technique to improve your Forex trading.
Firstly, let’s see what ‘spread’ means in this context. Usually, in Forex, the spread is the difference between the bid and ask prices. However, here we are concerned with a different kind of spread: the bonds yields spread. For example, if US 10y bonds yield is 2%, and UK 10y bond yield is 1.5%, the spread would be 0.5 percentual points. Higher spreads suggest that interest rates are higher in a country relative to another. As we will see, these spreads can be valuable in trading.
How do Bonds Spreads affect the Forex market?
Now that we know what the bonds spread is, it’s important to understand how spreads influence the Forex market. This relation depends on one main factor – interest rates. Interest rates are the basis of any bond, and higher interest rates will mean higher bond yields. Interest rates can affect the Forex market because of 2 main reasons:
1. Institutional and Private Investors
Yields are dependent on the interest rate defined by Central Banks. If the Fed or the ECB decide to increase interest rates, bond yields from the respective companies will also increase. This happens because bonds are dependent on the interest rate from the country where they are issued. A rise in interest rates means bonds will pay a higher interest, i.e., have a higher yield. Investors will, therefore, get higher returns.
When interest rates are higher in country A relative to country B, bonds from country A are more attractive. Investors will prefer to put their money in these bonds since they pay higher coupons.
To buy bonds, investors will need to exchange their currency for the currency in which bonds are traded. So, the currency with higher yield bonds will have a higher demand.
2. Central Banks
As already said, the price of bonds depends on the interest rates defined by central banks. According to their monetary policies, central banks buy or sell bonds in order to achieve the desired interest rate. To raise the interest rate, central banks sell bonds, increasing supply and reducing bonds prices. Bond yields and their prices go in opposite directions so, when central banks raise interest rates, prices fall and yields rise. In this sense, when central banks sell bonds, they are withdrawing money out of the economy. This will make the currency appreciate. The reduction of money in circulation makes each unit to worth more.
Both arguments explain the positive correlation between bonds spreads and forex. From one side, higher interest rates will attract more investors. These investors will increase the demand for the currency in which the bond is traded. On the other hand, higher interest rates mean Central Banks are selling bonds, which reduces the supply of money in the economy. The two will contribute to an appreciation of the domestic currency.
Simply put, between two countries, the currency of the country with higher interest rates tends to appreciate.
Looking at some examples…
Traders can expect an appreciation in the domestic currency after a rise in interest rates. We can see this positive correlation between bond spreads and forex in the following charts.
Although the correlation between bonds and spreads is positive in the overall picture, there are periods where both diverge from each other. Those divergence periods are annotated in red.
USD/JPY vs US 10Y / JP 10Y Yield Spreads

In this chart, it’s possible to see a very close correlation between US bonds and Japanese bonds spreads and USD/JPY. However, there are two main periods we want to highlight:
Divergence (in red): During the period from December 2011 to April 2016, there was only one period in which the positive correlation did not stand. The period signaled in red shows a high volatility in bond spreads while the pair traded relatively flat. This is a divergence.
Spreads leading USDJPY (in yellow): we see how the major increase in spreads that happened in August 2013 only affected the forex market one year later. Actually, it’s very common to see this lag correlation, usually with spreads usually leading the pair between 2 and 10 months.
GBP/USD vs UK 10Y / US 10Y Yield Spreads

Spreads leading Pair (in yellow): We can see yet again, in this chart, how a major drop in the forex market follows a major drop in spreads only months later. Both charts show how, very often, spreads movements lead the Forex pair’s movement.
Divergences (in red): In 1 and 3, GBP/USD rose while bonds went down, while in 2 and 4, the contrary happened.
How can traders benefit from this relationship?
Traders may profit from the above-mentioned correlation in two main ways:
1. Through carry trade. It involves borrowing in the country that has a lower interest rate and buying a bond in the country with the highest. As long as the exchange rate remains the same, the bond spread is the profit. However, this strategy can be risky, since the movements in the Forex pair will ultimately compensate for that differential. In practice, this has to be implemented within a hedging strategy.
2. Divergences between spreads and the Forex pair. We know that spreads usually lead the Forex pair by some months, so when they diverge, we know that the pair’s movement is nearly ending. For example, if GBP/USD is rising, but the bonds spreads are falling for some months already, you should be getting ready to short GBP/USD.
Resources
All the data collected for the research was extracted from www.investing.com and bond yields data from Fxmacropulse.
Conclusion
The relationship between bonds spreads and forex is a very useful analysis to forecast movements in certain pairs. However, traders should do a more broad analysis of the market before entering a position. In the article Intermarket Relationships in Forex, we explain how other factors such as the price of commodities and stocks also affect the Forex market.

