
Gold (XAU/USD) and Silver (XAG/USD) are naturally, two very correlated commodities, and the recent action is no exception.

Gold is near a support and a previous broken trendline. There was recent strength (blue signal) with moderate volumes, in an area of previous strength, which could be the first signal the support is holding, but so far the market doesn’t show signs of stabilizing – it keeps making new lows, and the background is still weak.

Silver is too near a support, and in the mid of a down trending channel. Given the price range silver showed today, and the fact it broke a previous support at 15.8, it was expected that the recent strength has higher volumes than in gold, since more traders and stop-losses were ‘shook-out’. Like gold, it’s making lower lows, and the background is still weak mostly due to the downtrend. I would like to see a rally to finally break the downtrend and confirm the recent strength was in fact accumulation; if the downtrend is to continue, it’s probably going to test the demand at 1162 in gold, which occured in early June. In the case the market rallies and it gives an opportunity to enter, I’d be more inclined to invest in silver rather than in gold, or at least to have a larger position in silver, as XAU/XAG (Gold/Silver ratio, tradable in some brokers) is showing major selling, which it’s preventing it to break a key resistance.

Prices are just now breaking-out the resistance at 191.93, formed at 5/June. The background is positive, though the market has been on a strong trend for 3 days now, so a pause after the break-out is likely. I want to see a good volume on the break and a test bar (gray histogram bar) afterwards. Given the circumstances, it’s likely the market will have to be shaked-out, with prices coming to 191 2 price level, so the stop-loss can’t be too tight.
 Like I wrote in the previous post about USDCAD, there was an high chance of a false break-out of the 1.253 resistance due to the weak background, and previous supply signals at that level, meaning it was a likely distribution level. The candle that took prices above the resistance, yet closed below it, due to selling pressure, was a good confirmation of the false break-out and hence a good spot to short. Closed the trade after 2 bullish congestion zones.

This pair has been showing significant supply at 1.25 and up, with no previous resistance, which means it isn’t overhead supply (which is usually not something to worry about). The most significant resistance is at 1.25369, which is the high of the previous supply bars. There is a trendline coming from almost the beginning of this rally, since 12th May, which is the level to watch for an eventual short trade.
There is a high chance there will be a fake break-out, in order to get more longs trapped and to catch the stop-losses of shorts, which would confirm that this is in fact distribution. This would be a break-out with either low volume, or a break-out with supply signal right above the resistance after it was broken. To the downside, a break-out of the trendline with good volume would be a trend change signal, if the background keeps at being weak, and given the weakness behind. At the moment the pair is making successive higher lows, which means that for now the prices are being supported, and the dynamic trend is giving the same indication as it’s still up.
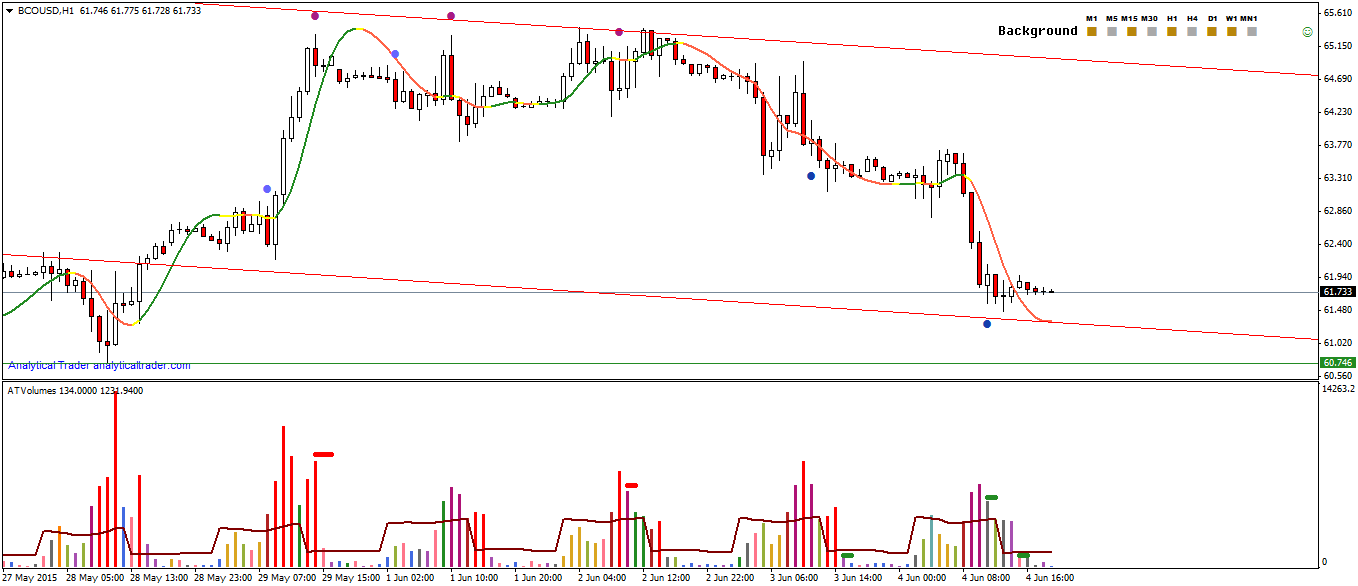
Brent crude oil, which is related to the Canadian Dollar, as Canada is a big oil exporter, is on the lower part of the trend channel, and recently showed a demand signal, at a previous strength area. It’s not showing the sideways movement as USDCAD is though, so I’m waiting for prices to stabilize at this level or to make a higher low, and for the background to change to strong.

GBPUSD is trading near a support formed at 19th May, and is also near an up trendline coming back from 20th April. After the Pound bull market being stopped by professional selling around 1.578 (purple signals), and consequently going into a correction, more recently it has seen buying at this level. This may mean this is actually re-accumulation, and so the bull market may be sustained. The background reflects this and it shows up as strong.
If prices stabilize in a few more bars (i.e. they don’t make lower lows), and make a higher high, there is a potential long entry in a down bar. Meanwhile it’s important to notice that there is another validated trendline, to the downside. So if prices break the support, and the background keeps being strong or neutral, I’ll look for a strong signal near the lower part of the channel.


This would hav ebeen a good trade if the prices were nearer to the support, as the background(100) was strong and there were demand signals near the support, signaling that the smart money was buying. See Nearby support trading.

