
USDJPY

On the last post I noted that USDJPY was on a trading range, and the closest zone to watch was between 106.200 – 106.300. Prices reached that zone on the Asian session, and did so on wide high volume bars, breaking-out 106.200 to the downside, which also made the background turn to weak. The price was still sustained for a few hours after demand, but a few hours before London’s open, the activity spiked up again and more selling showed up again as a wide-range down bar, closing on its lows. These lower prices didn’t held up for long though, and after one more demand signal from VSA, the prices broke a down trendline and kept the uptrend until heavy supply hit the market and turned it sideways, onto the trading range we are seeing at the present. USDJPY is also getting to the break-out point of 107.600 support, which is important because that is the last point where many sellers got in. I would like to see a small rally after this downtrend, or the background turning weak, to consider taking short positions. Any position will have to be taken at most at tomorrow’s London session and in a low timeframe, as NFP is on Friday.

AUDJPY
This pair is near a support, at 79.527, and near a down trendline now at 80.100. Yesterday we have seen more demand above the formed support, though the rally after it failed spectacularly after there was no follow-up to the very high volume candle, with VSA showing a minor Supply signal 2 bars afterwards. The correction is showing low volumes, hinting at a temporary lack of supply, and the background is very strong. Reversals at sensitivity 7 have a good record on this pair and timeframe, even weeks back, and one near the support would be a possible long entry point. The safest would be to wait for the trendline break though, for confirmation. Meanwhile the prices are reaching the demand zone and it’s also important to be on the look-out for selling in the form of wide high volume down bars, like was seen on USDJPY yesterday on a similar occasion. Together with USDJPY, if the price/development confirms it, they could be two good pairs to trade against each other (one long and one short), since they are positively correlated by 50% due to the Yen.

After a wide upthrust bar, also marked as heavy supply, on last Wednesday, the Yen broke the support at 107.62 the day after. It broke with healthy volume, and the prices only stopped downtrending on a reverse upthrust, and later a churn, which are volume patterns that show demand.

USDJPY H4 Breakout
On M15 the action can be seen more clearly, and the trading range in the last days is more evident on this lower timeframe. By today’s end of Tokyo session, at 5 am GMT, the market showed supply on very high volume, from the three timeframes – M15, M30 and H1. Right now the prices are trending lower, though on very thin volume due to Japan’s bank holiday on 3rd May. Thinly traded markets can be an opportunity for large players to make their movements however, since there is little to no resistance to any significant organized action.
It would be wise to be on the lookout for more demand/strength between 106.200 – 106.300. To the upside, the price 107.62 is the trigger for short positions, if the supply shown in H4 proves to be consistent. The fact that there are many announcements regarding unemployment on US will surely provide plenty of movements, and make the price reach these critical areas in USD/JPY.

USDJPY M15 Demand Zone
Gold
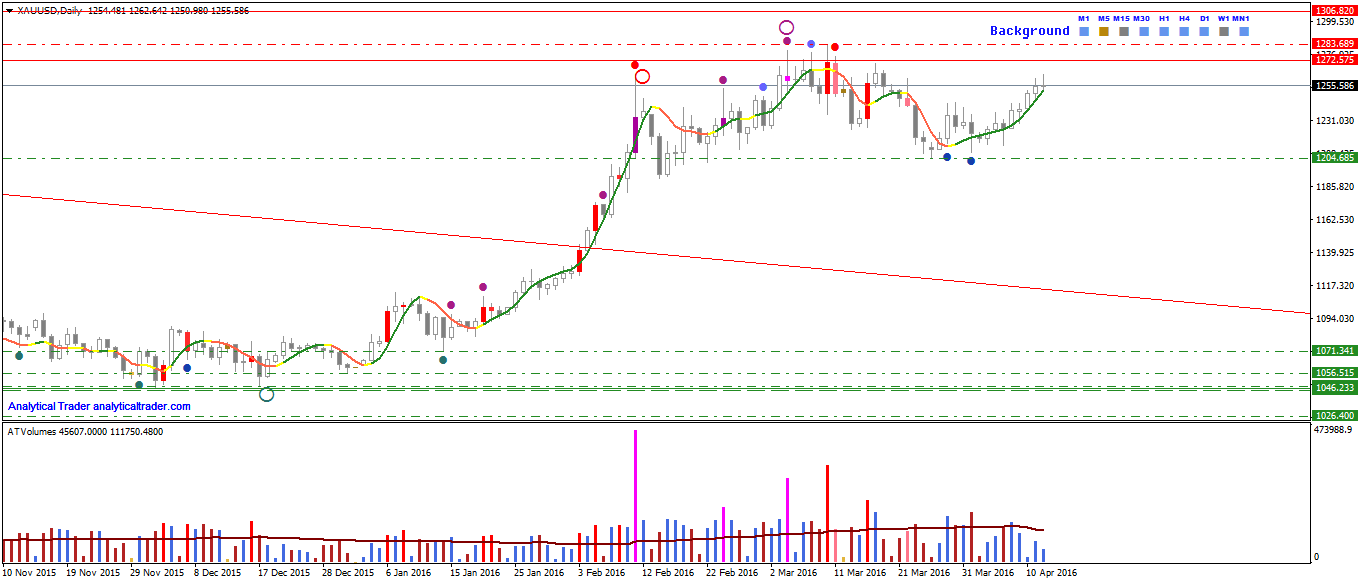
Upon reaching $1235, there has been significant selling on gold by major players, which can be seen by the volumes in both Forex (on high liquidity brokers) and Futures. An important high was made at $1272, which held on multiple break-out attempts. On the most recent low, VSA also showed some demand, which started this new rally onto the previous highs. Volumes are drying up and today’s price is on the lows of the day. If the weakness continues on this rally, it’ll form an head and shoulders top (with selling behind, which is perhaps more important than the price formation), and we’ll be looking for shorts near $1272 or on the break-out of $1204.
Brent Crude Oil
Brent Crude Oil took a pause in the uptrend and corrected, when prices reached the upper part of the trading channel like we noted on the last Crude Oil analysis. On reaching the trendline, both VSA and Reversals signaled a reversal, but after the trendline was broken the rally attempt first showed high volume on a narrow range bar (first arrow), afterwards an upthrust, a bar making a higher high but closing on the lows, and afterwards more high volume even though prices didn’t move much.

Crude Oil H4 – Failed rally attempt after trendline break
Later, again using the previously set sensitivity (4), Reversals showed the way, and finally the retracement was over, this time without any vacillating type of rally. This rally made the prices reach the top of the daily channel. Right now lower timeframes look more promising to trade crude, since the current move is already well extended, though there is no significant weakness to look for shorts just yet.

Crude Oil Daily Trend
Trading the supply/demand signals directly, without taking anything else into account, is a common mistake which often leads to losses. Demand during a strong downtrend can mean it’s profit-taking or just some buying, that may or may not have a follow-through. In this trade,
1. The background was weak, and so we should be looking for short positions (in weak signals), as explained here Supply/Demand + Background.
2. Next to the demand bar, there was a no-supply test (painted as blue), that was testing lower prices for supply. The prices however didn’t rally afterwards and break its high – if professionals were interested in buying, they’d get in after such an indication of no-supply, and a rally would follow, which did not happen, and so the latent supply kept on moving the market downwards.

Demand-Downtrend-USDJPYH1
Tomorrow the number of US non-farm employment change numbers will be released, together with the Unemployment rate. Before, at 9:30 UTC+1, the British manufacturing PMI will also be known. GBPUSD is on a short-term uptrend, and on the long-term, it’s near a down trendline. In the last top at yesterday’s London/US session, there was considerable supply, and as in today’s London session prices attempted to rally, it was met by further selling, shown as an upthrust. Due to this recent weakness, a break of the up trendline would be a good confirmation of a downtrend to come. If the news are positive to GBPUSD however, since there are sellers around 1.441 – 1.444, a whipsaw could occur as these could take the high liquidity as an opportunity to continue shorting.

News, Trend and Supply/Demand in Sterling
In the first hours of today’s London session, activity and volumes spiked up in gold. This activity, VSA showed, was major supply hitting the market, just below a high formed days before, on heavy supply, at $1258. In the last post we noted that below $1270, the “control point” of selling of the last weeks, we should be looking for shorts in lower timeframes, and this was the ‘golden’ opportunity.
In M15 there were multiple supply signals, and the background turned from strong to neutral.

Supply in uptrend in Gold M15
In M5 the dynamic trend turned red shortly after, when the short was taken, with SL above the previous high and TP a bit above the down trendline, where buying is to be expected. Prices went down on wide range and reached the target, with the rally afterwards showing low volume. When prices attempted to break the trendline, VSA showed Minor Demand, and the price then went up on high volume. The no-demand test shown in M5 (pink bar) succeeded, as there was supply afterwards and its low was broken, which is a temporary stop of the uptrend. The background is strong in M5, and more demand, or a bullish test, just above the broken down trendline, would be a long.

Supply and trend turned down in Gold M5

