
We’re proud to announce our partnership with NinjaTrader, which means all of the trading tools we have will soon be available for NinjaTrader 7!
So, for those who don’t know, what is NinjaTrader exactly? It’s a multi-asset platform, a free one, where you can check the charts, and trade various types of assets, from stocks, to Forex and futures. For Forex and futures, the live data is free when registering by certain brokers/data providers, such as FXCM. For stocks, end-of-day data is free for the stocks of US major indices.
NinjaTrader also brings an easy automatic strategy builder, where you can construct a robot using indicators and trade management rules, and to backtest it, without having to do any coding. While offering these features, the platform still maintains its user-friendliness and intuitiveness.
We think this is a very broad and powerful trading platform, and definitely worth a try if any of the features interest you. From our part, once we have the tools available, we’ll be using it regularly, including in the blog posts. Due to the broader asset offer, we’ll also expand on the assets that we cover here in the blog, and the strategies used.
Pivots and Dynamic Trend
You can download, for free, our first indicators for NinjaTrader, Pivots and Dynamic Trend, through this page:
» Download Complementary Indicators
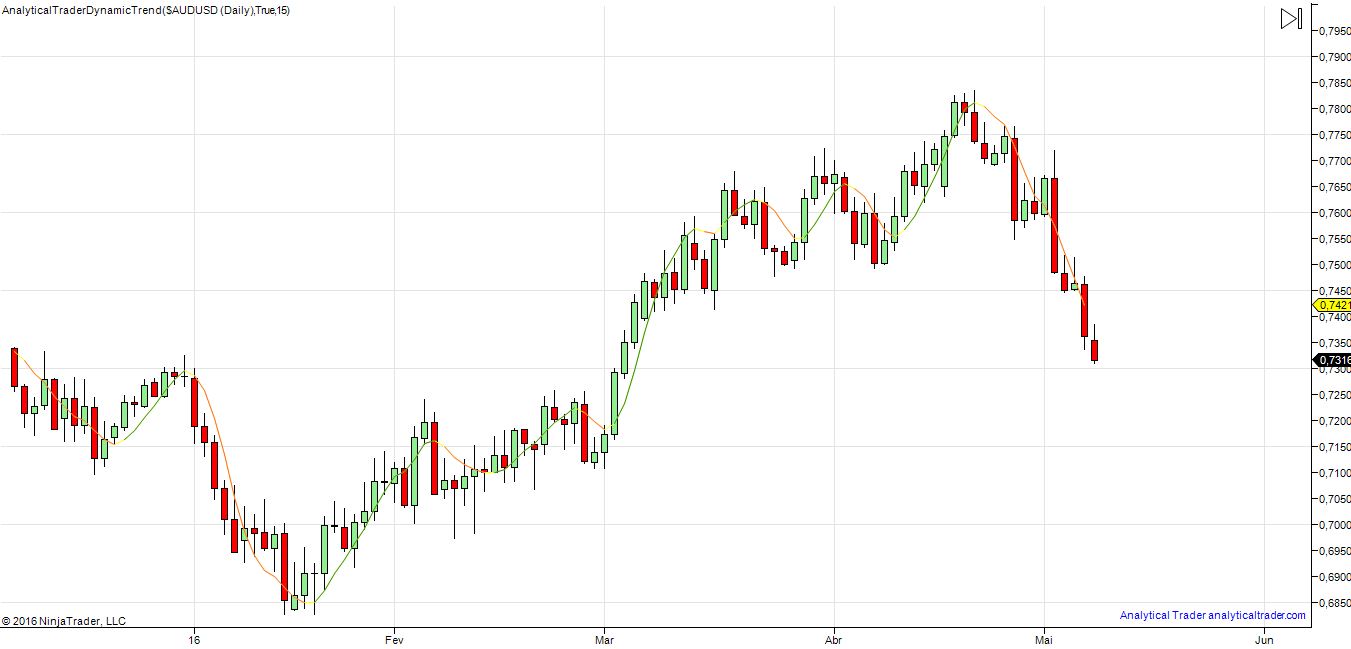
Dynamic Trend in NinjaTrader
Soon we will release other tools for this platform, new educational content, and a brand new indicator is coming for Metatrader, so make sure to check regularly! And as always, if you have any questions, feel free to contact us.
USDJPY

On the last post I noted that USDJPY was on a trading range, and the closest zone to watch was between 106.200 – 106.300. Prices reached that zone on the Asian session, and did so on wide high volume bars, breaking-out 106.200 to the downside, which also made the background turn to weak. The price was still sustained for a few hours after demand, but a few hours before London’s open, the activity spiked up again and more selling showed up again as a wide-range down bar, closing on its lows. These lower prices didn’t held up for long though, and after one more demand signal from VSA, the prices broke a down trendline and kept the uptrend until heavy supply hit the market and turned it sideways, onto the trading range we are seeing at the present. USDJPY is also getting to the break-out point of 107.600 support, which is important because that is the last point where many sellers got in. I would like to see a small rally after this downtrend, or the background turning weak, to consider taking short positions. Any position will have to be taken at most at tomorrow’s London session and in a low timeframe, as NFP is on Friday.

AUDJPY
This pair is near a support, at 79.527, and near a down trendline now at 80.100. Yesterday we have seen more demand above the formed support, though the rally after it failed spectacularly after there was no follow-up to the very high volume candle, with VSA showing a minor Supply signal 2 bars afterwards. The correction is showing low volumes, hinting at a temporary lack of supply, and the background is very strong. Reversals at sensitivity 7 have a good record on this pair and timeframe, even weeks back, and one near the support would be a possible long entry point. The safest would be to wait for the trendline break though, for confirmation. Meanwhile the prices are reaching the demand zone and it’s also important to be on the look-out for selling in the form of wide high volume down bars, like was seen on USDJPY yesterday on a similar occasion. Together with USDJPY, if the price/development confirms it, they could be two good pairs to trade against each other (one long and one short), since they are positively correlated by 50% due to the Yen.

After a wide upthrust bar, also marked as heavy supply, on last Wednesday, the Yen broke the support at 107.62 the day after. It broke with healthy volume, and the prices only stopped downtrending on a reverse upthrust, and later a churn, which are volume patterns that show demand.

USDJPY H4 Breakout
On M15 the action can be seen more clearly, and the trading range in the last days is more evident on this lower timeframe. By today’s end of Tokyo session, at 5 am GMT, the market showed supply on very high volume, from the three timeframes – M15, M30 and H1. Right now the prices are trending lower, though on very thin volume due to Japan’s bank holiday on 3rd May. Thinly traded markets can be an opportunity for large players to make their movements however, since there is little to no resistance to any significant organized action.
It would be wise to be on the lookout for more demand/strength between 106.200 – 106.300. To the upside, the price 107.62 is the trigger for short positions, if the supply shown in H4 proves to be consistent. The fact that there are many announcements regarding unemployment on US will surely provide plenty of movements, and make the price reach these critical areas in USD/JPY.

USDJPY M15 Demand Zone

