

GBPUSD is trading near a support formed at 19th May, and is also near an up trendline coming back from 20th April. After the Pound bull market being stopped by professional selling around 1.578 (purple signals), and consequently going into a correction, more recently it has seen buying at this level. This may mean this is actually re-accumulation, and so the bull market may be sustained. The background reflects this and it shows up as strong.
If prices stabilize in a few more bars (i.e. they don’t make lower lows), and make a higher high, there is a potential long entry in a down bar. Meanwhile it’s important to notice that there is another validated trendline, to the downside. So if prices break the support, and the background keeps being strong or neutral, I’ll look for a strong signal near the lower part of the channel.


1. The important in the trendline setup is that there is no significant supply recently, that could turn the trend down. In AJ there was some selling when there was a rally attempt, but since the volumes weren’t that high, they were no reason for concern.
2. Wait for a long entry bar, shown by the volumes histogram above the histogram bars. Here they were low spread down bars, but there are others, like low volume down bars, tests, etc… There were actually 2 supports to choose to where to place the stoploss, but the support at 94.306 is more significant, and it wasn’t too far away, to keep a good R:R.
3. Exit in a weak minor signal (minor no-demand) when prices are approaching a previous long-term resistance.

The Yen is on a trending channel, and recently got to the upper part of it. After an attempted break-out, the market quickly reversed, which was marked as supply by a purple dot above the candle. Looking back though, we can see there was an avalanche of demand bars around the 118.500 level. It was also accompanied by very high (red) volumes. Looking even further back, more such signals can be seen, starting from 18th March. This is actually a retracement of an uptrend started in January/2015, which is where that up trendline in the chart is coming from.
Given the accumulation signals, given enough time, the balance is tilted to the upside, so I’m not looking for shorts in this pair, even if there is a high chance that it’ll reverse to the support at 118.486, or even just to the up trendline – and there’s where I’ll be looking for longs, in a test bar. A break-out of the 120.842 with good volume would also be a good confirmation of the potential strength behind.

In this short trade there were 2 major errors:
1) There was a nearby Major Demand signal. Even though a down trendline is nearby, with significant demand behind, there is a high probability that it’ll break, or that a significant rally is to happen, hitting the stoploss. In this case there was a demand signal which prevent further losses, but as you can see the price then rallied significantly.
2) The background was blue (strong) at the time – it analyzes the supply/demand signals and trend, so a strong background means the conditions are right for a trend change, not a downtrend continuation.
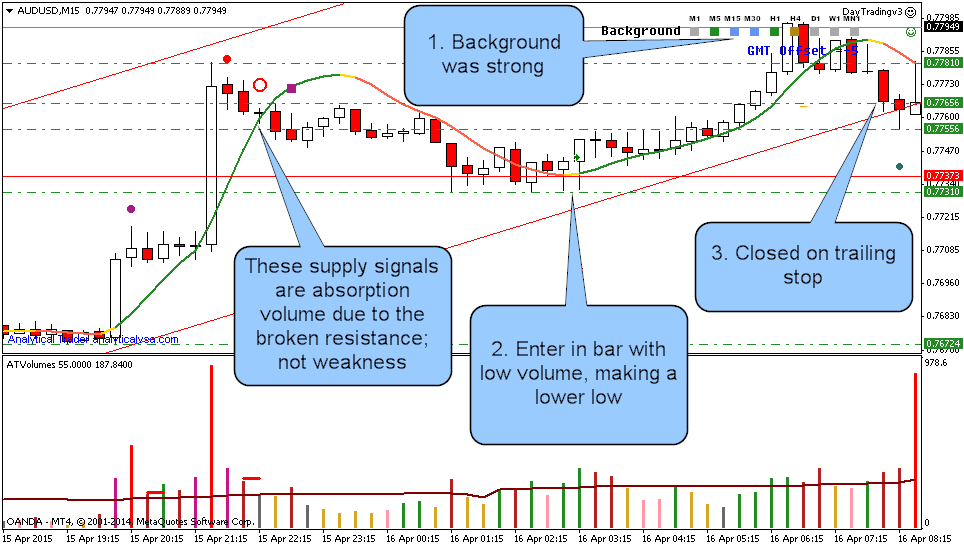

1. Strong background. Another alternative, since there was a resistance break-out, is if there were strong demand/major demand signals before the break-out.
2. Enter in a bar with low volume. There were also other previous valid bars.
3. Closed on trailing stop. Trailing stop is a must for intraday trading, where whipsaws are the rule.

