

After opening an account with a broker, traders need to be aware of the different chart types out there. These are essential for traders in terms of decision-making as the information they supply is much valuable. In the following article, we will cover the most popular chart types used not only in Foreign Exchange but in most financial markets. We will also reference other ways in which technical analysis can be more effective. But first, how exactly are Charts illustrated in trading?
Chart
Charts are usually represented either linearly or logarithmically, being the X axis time and the Y axis price. Most commonly used Charts are time-based, but there are also popular Charts that do not rely on this factor, as we will see on ahead. As such, in this type of Charts, price movement is represented depending on what Time Frame you are analyzing. These can be set to be daily, weekly or even monthly or charted on Intraday Time Frames as small as 4 hours, 1 hours, 30 minutes, 5 minutes or even every 1 minute.
The main advantage of having several Time Frames is that you can conduct Multiple Time Frame Analysis. This, as we discussed in previous articles, is a great aid when trying to spot better trading Scenarios. Furthermore, being time-based, this enables traders to view prices live, base their actions on past data and time their orders in a simple and effective way.
Another indicator, often overlooked but commonly used with time-based Charts in technical analysis are Volumes. These give us the number of times a contract or share was traded in the market and are a measurement of market strength. This means that the relevance of the price action often depends on volume in that time.

Line Chart
The Line Chart, one of the simplest charts, only illustrates the closing price of the security in the specific Time Frame. The line is drawn, per example, by connecting the closing price of the GBP/USD at 11 p.m. to its next closing price at 12 p.m.

It is a clear and simple way of getting a general idea of the price movement’s direction in the market, which is preferred by some traders.
Nonetheless, it lacks information that is also important like the highest and lowest prices that the security reached in that Time Frame. This fact may be a deal breaker for traders whose strategies rely on these indicators, such as those who trade supports or resistances. Trading trends or retracements can also be applicable in a line chart. However, other charts simply provide a more in depth analysis than line charts which is in most cases is preferable for technical Analysis
Bar Chart
Bar Charts, also referred to sometimes a type of OHLC Charts, add on the previous chart by being able to show Opening, High, Low and Closing prices, as the acronym sujests. They are composed of a series of vertical lines that represent the price range during that Time Frame. In addition, each vertical bar has two horizontal bars: One on the left indicating at what price the security opened and another on the right indicating at what price it closed.

Contrary to the line charts this will enable the trader to paint a better picture of the market with ease. Patterns and different signs that these bars can give allow the trader for a much more thorough analysis.
Candlestick Chart
Similar to the bar chart, the Candlestick Chart gives traders the same information but are represented in a different way.
The wider part of the candlestick is shown between the opening and closing price. It is typically colored in black/red when the security closes on a lower price and white/green the other way around.
The thinner parts of the candlestick are commonly referred to as the upper/lower wicks or as shadows. These show us the highest and/or lowest prices during that timeframe, compared to the closing and opening price.
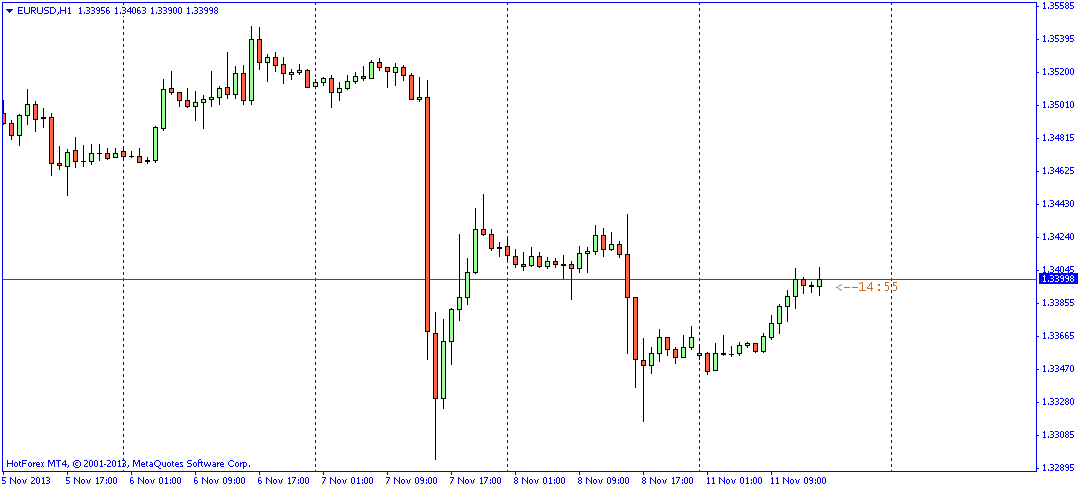
The main distinction between both charts has to do with the opening and closing prices. The bar chart focuses more on the relationship of the closing price from one Time Frame to another. On the other hand, with a quick look to a candlestick chart, market sentiment becomes much clearer. This due to the coloring of the real body of the candlestick which emphasizes the relationship between the closing and opening price within the same time frame. This illustration is one of the reasons why this type of chart is so popular.
Renko Chart
Unlike the other Charts, the Renko Chart focuses only on price movement, completely disregarding time and the usage of volumes.
This Chart is composed of white and black bricks. These are placed depending on weather the price rose or not compared with the previous brick. If it did by enough pips, established by the brick size, a new one is placed. White bricks are used when the price of the security goes up and black bricks when they go down.

It is important to point out the fact that a new brick is only placed under certain volatility criteria. Either resulting in a major advantage or disadvantage for traders. It can be placed in a matter of minutes or take more than a day depending on market conditions. On one hand, this may be advantageous. Especially for traders who want a simple way of identifying supports and resistances, the overall trend and filter noise. On the other hand, this can make market sentiment hard to determine. Consequently rendering the usage of other analysis tools useless.
To Sum Up
Each Chart has its own utility. However, their usage depends on the type of trader you are and strategies that you prefer to put in practice. So, having a general knowledge of the options you have when it comes to analyzing securitie’s behaviour is an advantage.
To go even further and put to practice some of the concepts discussed in this article you can download a demo of our VSA package. Improve your trading results with supply/demand Signals and other indicators that this Trading System provides.
Hope you enjoyed this article. Feel free to comment and share it with a friend!

Still on Forex terms and concepts, we found more terminology that we think is also really important. Especially for Traders wanting to open their first account and taking their first steps in Forex. As such, in this article we will go through 4 more concepts that traders starting out should know.
Lots
Generically, a lot is measurement for a group of goods, that are alike, that are transacted in the market. In Forex, lots are the standard measurement in trading when placing orders.
One lot represents an order of 100.000 units. This means that you would be buying/selling 100.000 units of the base currency while selling/buying 100.000 of the quoted currency.
Subdivisions of a lot are also common. Namely mini lots and micro lots, which ate composed of 10.000 and 1.000 units respectively.
Leverage
Being leveraged consists of contracting debt for whatever investment strategy a trader might have. It is mostly used as a way to aid and amplify a trader’s position on any type of financial asset. If a Trader opens an account with a leverage factor of 250:1, this means that for every euro he holds, he can control up to 250 euros. One can refer to this account as being highly leveraged.
It is important to point out that a common misperception is that having more leverage means that trading forex is riskier and thus should be completely disregarded. This is should not be the case. Traders should be aware of both sides of the coin.
The major benefit is that you can make much larger gains with a small investment. However the other way around also applies. Losses are amplified when the trade is leveraged.
So, taking this into consideration, if that added capital to your account is controlled, it will enable you to trade more currency pairs, a higher lot, and diversify your Portfolio.
Margin
Margin and leverage are two terms that refer to borrowing money. So, they might appear to be very similar. However, they should not be confused, as they are two different concepts.
If you have margin, this means you can borrow money from your broker at a fixed interest rate to invest. The act of borrowing the money with this purpose is to have a margin, whereas being leveraged is just having debt.
Simply put, if you are trading on a margin you have to be necessarily leveraged but the other way around might not be true. This because you can have leverage for a different purpose than to acquire financial assets.
Commissions
In Forex, these depend on the type of account you open with your broker. The most basic accounts that brokers usually offer don’t have any commissioning per negotiated lot, only a spread associated with trading.
Both “Pro” and “ECN” accounts, however, typically have commissions associated with each trade, with the added benefit of tighter spreads, being must more advantageous for Traders with more capital.
Moreover, it is also advised to take into account the spreads offered by brokers. More importantly, on the currency pairs that you normally trade as a few pips can make a difference in big lots.
To Sum Up
When first starting out, educating yourself is fundamental. Like we said in the previous article, there are many more concepts out there. As such constantly reviewing the ones you know and adding more to your vocabulary is a definite plus.
Hope you enjoyed this article. Feel free to comment and share it with a friend!

Like in any work environment, getting a hold of the terminology used on a daily basis is crucial. Trading forex is no exception. In this article we will go through some of the terms that we think are most commonly used in Forex. These are essential to better understanding how the market works.
Currency pair
All transactions being made in foreign exchange involve buying a currency while selling another one. Furthermore, a currency’s value can only be determined through comparison with another one. As such currencies are quoted in pairs. For example, one of the most traded currency pairs is the EUR/USD.
In this case, the base currency, the one on the left of the slash is the Euro. Conversely, the US Dollar is designated the quote currency. The base currency is the security you want to buy or sell while the quote currency sets the price at which you can exchange the base currency.
Still on the EUR/USD example, if the quote is 1.1862, this means that to buy 1 euro you would have to sell 1.1862 dollars. If the trader wanted to sell 1 euro he would receive 1.1862 dollars.
These currency pairs can be thought as being a single asset being traded. So, if someone buys the EUR/USD pair, this means that they are exchanging dollars for euros and when selling the other way around.
Major and Minor pairs
When talking about currency pairs, they can be usually referred to as Major or minor pairs. Major pairs are among the most transacted in Forex and the ones that offer more liquidity. For example the EUR/USD, USD/JPY and GBP/USD. All other currency pairs that aren’t as transacted are considered to be minor pairs.
It is also important to point out cross currency pairs. Although not so commonly traded, these are the currency pairs that don’t involve the USD, and thus usually have associated with them higher transaction costs.
Pips and Pippetes
A pip (percentage in point) is the most basic measurement of price movement in currency pairs in the Forex market. Usually, currency pairs are expressed to the fourth decimal case, being the pip the last one. For added precision, some traders even look at pippete, which are 1/10 f the pip, in other words, the fifth decimal case. So, for instance, if a currency pair changed from 1.1862 to 1.1863 this meant that it changed 1 pip. This measurement applies to most cases but there are some exceptions, such as the USD/JPY (109.55) which is presented in most cases to the second decimal case.
Being aware of pip variation is extremely important when calculating expected returns and positioning yourself in the market.
Bid-Ask Spread
The bid is the price that traders are willing to pay to acquire a security. On the other hand, the ask is the price that traders are willing to make to sell a security, being the bid the smallest of the two. These are, essentially, indicators of the supply and demand for a specific security. The difference between both gives us the bid ask-spread. The tighter the gap between both the more liquid is security being traded. In other words, it can be sold more easily and quickly converted to money. Trading currency pairs are thus considered to be the most liquid assets to trade.
You can think of this as an ongoing negotiation taking place in the market. On one side you have those who want to exchange the base currency for the quote currency. On the other side, you have those that want the exact opposite. The broker/market maker will offset this apparent imbalance in the market and charge you the spread every time you want to exchange. This is considered the main transaction cost each time you trade.
It is important to point out that the current price of a pair is usually neither the bid nor the ask. It is the price at which the currency was last exchanged.
Going Long/Short
As previously mentioned, when buying/selling currency pairs, this is usually done depending on a traders’ belief on the future value of the base currency compared to the quote currency.
A trader is said to be bullish when he has a positive expectation regarding the value of a pair. In foreign exchange, like in any other market, bull traders hope to profit from an upward movement in a pairs’ price. Simply put they hope to buy and hold a currency pair and eventually sell it at a higher price after appreciating in value. This is usually designated as “opening a long position“.
Investors’ and traders’ attitude towards the market is called sentiment. So, even though there are bull traders, pessimistic traders also exist.
Which brings us to bearish traders. A trader is said to be bearish when he expects a currency pair to devaluate. In this case, they will go short on a currency pair. This means that a trader will borrow a currency pair from a broker, sell it and then, when closing the short position, repurchase it to the broker at a lower price.
To Sum Up
There a lot of jargons used in Forex and it can be easy to be overwhelmed with all of these concepts. However, when you get down to what they really mean, it isn’t all that difficult.
Constantly learning about new ones, or just reviewing them, is essential to becoming a better trader. With this in mind, we advise you to read more on our other articles and improve your knowledge on the subject.
Hope you enjoyed this article. Be sure to comment and share it with a friend!

