

As a retail trader, your orders will hardly have any influence on the overall market prices. However, when large investors such as commercial traders or professional traders place their orders, they will likely define where prices are heading. Therefore, it’s of extreme importance to find what these large traders are doing and to be on their side. In this article, we intend to explain how you can spot what the big players are doing, i.e., tracking the “smart money”, and take advantage of their actions.
What is the “Smart Money”?
So, what exactly is the “Smart money”? It’s the name we use to describe professional and large traders with a big amount of capital. In this category, we may find both institutional investors, investment banks and hedge/mutual funds. Not all funds can be considered professional since some of them lack the expertise or the size to truly impact markets. Besides, small funds usually do not have enough capital to place orders capable of influencing prices.
Besides being the traders with the largest amount of capital, these are also the traders with access to more information and knowledge about the markets. Note that both hedge funds and investment banks have huge teams of researchers continuously analyzing the market. They also spend large sums to have access to the latest news before the rest of the market. As such, the odds are that professional traders will spot some opportunities faster than the “average trader”. This is why it’s extremely important to know what they are doing. Due to the size of the organized actions of these traders, they are usually behind biggest price movements. Therefore, knowing what they are doing should be one of the first objectives of any trader.
Tracking the Smart Money
The most direct and efficient method to understand when these players act in simply by looking at a price-volume chart. Due to the large size of their orders, these traders are not able to hide their actions. There is a myth that says that because of dark pools, they are able to hide their actions. Some institutional traders do use dark pools, but they can only hide their orders during execution, which can be a matter of milliseconds. After the order is executed, there’s no way to hide it, as exchanges (and consequently Forex liquidity providers) will report it in the volume.
1- Interpret the direction of their trading
You’ll need to look at prices and volumes to know this. Our article about volume trading explains some ways to observe this. The important thing here is to see where there is a general and organized action, and various funds are buying or selling a currency consistently. You can see this in lower timeframes, like 1 minute, as well as in daily/weekly timeframes.
There are many supply/demand patterns, which our VSA indicator shows, and one of the most prominent SUPPLY ones is a wide range bar, closing on the lows, with volume above the average. The demand ones close on the highs instead. Even though these are wide range bars, many times the prices will continue trending, as you can see in the chart below.

General buying/selling pressure leading fast price movements

Buying pressure marked by high volumes that move prices upwards.
2- Take a look at fundamentals
In long-term trading (daily timeframe and above), good fundamentals make it more likely for big traders to have an interest in a given currency. Traders should be aware when talking about “fundamentals” given that some economic measures like the GDP growth or the interest rate hikes, although important, are not a leading indicator. We frequently see these variables changing only after price corrections in the value of the currency. Traders are better off by looking to the increase of the spread of the interest rates or the movement of a related commodity. These variables are usually a good proxy for the fundamentals that drive currencies and often are leading indicators. In the image below, for instance, we can see how correlated are the AUD with the price of Gold. If the price of gold increases, large traders know that this will benefit the AUD and start buying the currency.

AUD/USD – Gold (Source: Bloomberg)
3- Sentiment
“Listen to what the market is saying about others, not what others are saying about the market.”
-Richard Wyckoff
- Sentiment indicators such as COT report and SSI index will give you secondary information. Although it has its usefulness, COT report shows the actions of ALL large traders, even the ones that aren’t so good. Traders should, therefore, pay special attention to their analysis, because the report may have some lag in what comes to be a market turn. Traders should use the COT report mainly as a confirmation, or as a search mechanism for extreme values between large investors and hedgers. The image below presents some examples when the large spread was linked with a market turn
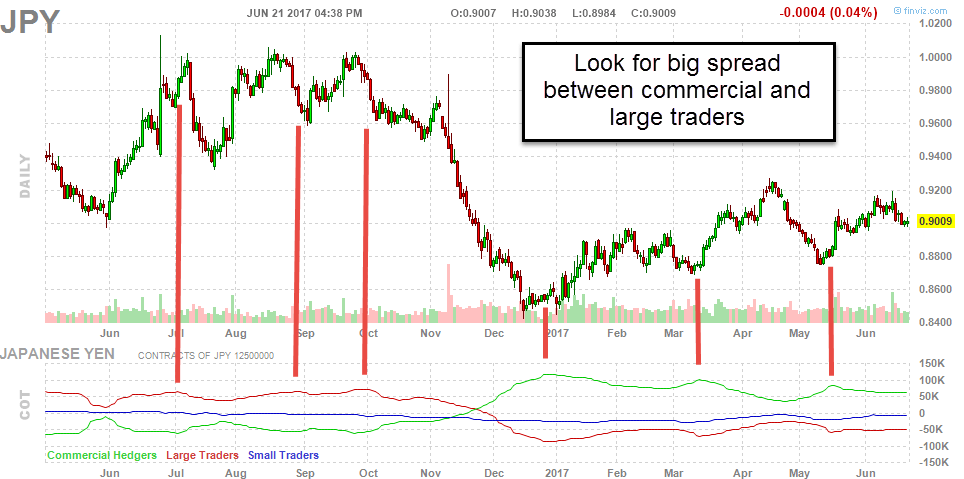
COT report
- On the other hand, the SSI shows the actions of small retail traders, which are usually wrong and in the opposite direction of smart money. In this indicator, look for historically high % of long positions to look for a short, and vice-versa for long positions. You can combine both information to be more confident about the right direction you should trade.
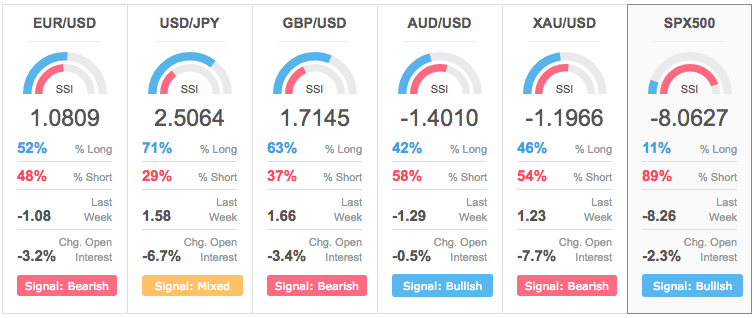
SSI Index
Conclusion
If you aren’t using volumes in your analysis, you are missing a big part of the picture. By showing the market’s activity, volume together with prices shows what the big traders are doing. Only these traders are capable of placing orders large enough, and in an organized manner, to sustain market trends, so you should look closely at what they are doing. By tracking the smart money, you can follow their actions and be on the right side of the price movement.
Feel free to comment below with any questions or feedback, and if you liked the article, share it with your friends!
“How much money can I make in Forex?” This is probably the first question a beginner makes, and it’s a completely valid question. Why invest my time and money into something, if I have no idea what the returns will be?

The truth is that Forex is an enormous market, with many interests behind. It’s usual to see brokers trying to “sell” the maximum they can as if it was like a gold mine, where you can get fast and easy results. In fact, beginners may have some trouble in finding viable resources. It’s easy to fall in the many traps in this business, and develop incorrect expectations since the start.
Returns and Risk is the Key
The returns you make, vs the risk you take, is really the key point. Even though it’s possible to have a 1000% return in one year, that would mean incurring in a lot of risks. To have this kind of returns, a trader would need to risk almost all of his account into one single trade. The problem of this way of trading is that it would be very difficult to survive over the long-run.
In the table below we present the bankruptcy probability or risk of ruin. On the top row it’s the win-rate and in the left column the risk/reward ratio per trade. As you can see, the key to winning in this game is to have a higher risk reward ratio. This will assure that, even if you have a low winning ratio, you won’t go broke in the long run.

Bankruptcy Probability
So, for instance, a trader with a win-rate of 30% and a risk/reward of 1:1 has absolutely no chance of succeeding for long. However, if we keep this same win-rate but increase the risk/reward ratio to 3:1, the probability of bankruptcy drastically drops to 27%. Of course, the risk of going bankrupt decreases with an increase in the win-rate and in the risk/reward rate.
Given that the win-rate of an average trader is somewhere around 50%, a risk reward ratio of around 1.5 is sufficient to almost eliminate the risk of ruin. However, the best is to always aim for the best risk/reward ratio, to keep the odds on your side.
How Much Do The “Big Guys” Make?
To get a sense of what you should expect is to know how much the best in this industry make. The list presented below shows the annual return as from 2014 of top performing Forex Hedge Funds.

Top performing Forex Hedge Funds returns in 2014
And how does Forex compare to other markets? The next image shows equities, commodities and other markets hedge funds returns between 2014 and 2016:

Hedge Funds Returns 2014-2016
Some claim that it’s easier to make money trading Forex because of high leverage, which allows to take more out of a movement. But as you can see, the annual returns between top hedge funds are similar between different markets. This goes to show that it’s all about return vs risk: while leverage offers more potential return, it increases the risk in the same proportion, which makes it a meaningless factor to judge the results.
How much should you expect?
A realistic return for a solo trader is around 20-40%/year, on average. A trader can sometimes get 100%+ or more in a given year, but unless you are a full-time trading expert, you shouldn’t expect to get this type of returns on average. And if you think about it for a moment, even if you start with a small amount, with a 20-40% return per year, you can build a small fortune after a few years. This is because of the compounding effect.
The image below shows, using this calculator, how you can easily simulate how much will your account grow in the future.
For example, starting with $5000, and with a 40% return per year, your account will be worth $35.000 in 5 years, for a total return of 700%!
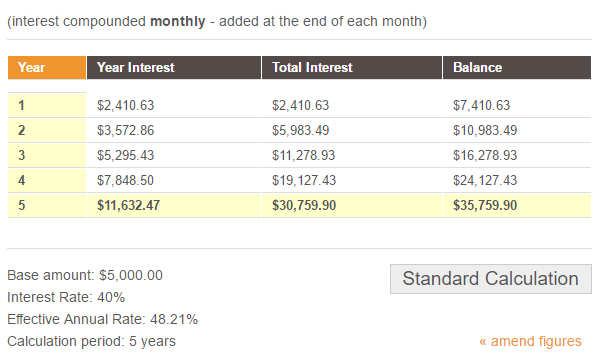
Now let’s assume that you even start with a more modest bankroll, such as $500, and you add $200 each month, with a 30% annual return. After 5 years, your account would be $30.000! Add more years and more money into the equation, and you can see how the compounding effect makes good traders become rich, even without having absurd yearly returns.
Taking a Look at a Scenario…
Now that you know how much is possible to get, on average, let’s take a look at a simple example.
Assume a scenario in which a trader has a $1,000 account and an average win-rate of 50%. An acceptable risk per trade is usually between 2-5% of your account in one trade. In this case, this trader would risk a maximum of $30 per trade. A 1.2:1 risk/reward ratio means the trader would place the target price at 1.2x the distance from the entry price of the stop-loss. If the stop-loss is placed 5 pips below the entry price, the target price has to be placed 6 pips above the entry price. This assures winners will be bigger than losers since the reward on each trade is 1.2 times greater than the risk.
With a limit of 2% per trade, this trader will only risk a maximum of 20$ per trade. This means he will lose $20 each time prices hit the Stop-Loss. On the other hand, he wins $24 if prices hit the Take-Profit.
15*$24=$360
15*($20)=-$300
Without commissions, growth profit would be $60 per month.
This is a 6% rate in a month, which can be considered very good. If we take into account compounding, a 6% rate per month means a 100% return per year! Of course, this is not a completely realistic return, as this example didn’t take into spreads and variability in each trade’s outcome. However, it gives an idea of the importance of having a higher risk/reward ratio. By doing this, any trader can aspire to have an expected return of 2-3 digits per year.
What Does It Take To Get Good Results In Forex Trading?
We’ve seen already how much is on the line if you have a good strategy. But what do you need to be successful in this game and achieve higher results? We consider these 4 points to be fundamental:
- Good market knowledge: It is essential to know how prices and volumes work, as well as which are the different players and what relations exist between markets. This will allow you to always be conscious of everything that’s happening around you and make you open the right positions.
- Have a probabilistic mindset: Trading is an unknown activity when it comes to the future. You can have several months with bad results but that doesn’t mean your strategy is failing. You need to keep developing your strategy to achieve better results in the future.
- Don’t think of trading like gambling: Forex is a business like any other. If you make good investments, you should expect a good return. If your attitude towards trading is to gamble like in a casino, the chances are, that you’ll end up blowing up your account!
- Consistency: Once you develop a good strategy, take advantage of it to be consistent with your results. A good strategy enables to achieve consistent returns over time.
The Bottom Line
Wrong expectations about returns usually lead to taking a lot of risks, which translates into a higher probability of losing the whole account. All traders, especially beginners, should be aware of how much they can get and what are their limitations. A trader who claims to have returns of 300%+/year on a consistent basis by trading Forex can only be a genius or a liar, and there are very few geniuses! The very best traders who are able to have outstanding returns for a long period of time usually have returns that don’t even match 100% per year.
The final takeaway is on the importance of establishing a strategy with a higher risk/reward ratio. A higher ratio allows you to lose more trades than you win and still earn money. This will give you an advantage over time.
Volumes are one of the most important aspects to look for in trading, even though it’s one of the most overlooked ones. Most traders don’t use volume, and most of the ones who do, don’t know all the ways volumes can help them. Volumes can tell you what you can’t find in prices, such as the relative number of traders that are selling or buying. In this article, we will see what differences between volumes exist and how volume trading can help you in better understanding market trends.

What Are The Differences Between Volumes?
There are two main types of trading volumes: trade volume and tick volume. But what are the differences between them?
Trade volume
This is the most common type of volumes. It is widely used to refer to the total amount contracts/shares traded in a given period.
Volume tells investors about the market’s activity and liquidity. Higher trade volume means higher liquidity, which leads to a better order execution.
Tick volume
In the Forex market, as it is a decentralized market, it’s impossible to keep track of the size and amount of all contracts traded in a given period. In this sense, as an alternative to trade volume, traders look for tick volume. Tick volume is the number of price changes in a time interval. The main difference is that tick volumes represent how many times the price changed in a given period, and not the real bid/ask volume. We assume that, if prices change 100 times in only 5 minutes, there’s higher activity than if prices only change 50 times.
In decentralized markets like Forex, tick volumes act as a good proxy for the real amount traded. Usually, the most price changes in a given period, the larger the number of transactions that exist. This would imply a higher volume. We made a study on the relationship between volumes vs. tick volumes, and turns out they are quite closely correlated. Check more here.
What Information Do Volumes Give Us?
Volume trading is a strategy that can be very useful since volumes can lead or confirm major price movements. Before opening a position, you may want to look at trading volume to see where the money is flowing to. Volume levels can also help traders decide what are the best times for a making a transaction.
High volume during a large price movement may signal the strength of the trend. Volumes may act as a leading or a laggard indicator. When there’s high supply volume during an uptrend or high demand volume during a downtrend, this may signal a trend reversal before the reversal actually occurs. On the other hand, high volume can also show strength and confirms price movements – it’s all about the context.
Volumes usually indicate what large traders are doing, namely if they are buying or selling. Large traders, as explained in this article, are the ones capable of moving prices. Therefore, the best is to be on their side and benefit from their actions. By looking at volumes alongside price action, you can identify if there’s higher demand or supply at certain points.
Volumes also allow identifying key levels of accumulation and distribution and congestion zones. These are zones where there are a lot of demand and supply and traders may face above-normal resistance. Price By Volume Indicator, which we explain below, can help traders looking for these key levels
How to Use Volume in Trading?
1. Trend Reversion
Many times we see volume spikes preceding price. A decreasing volume in an uptrend is usually a sign that it may be coming to a reversal. Traders should wait for a confirmation of prices to close positions or go short.
In the chart below you can observe how major moves in prices or price reversions were always accompanied by volumes higher than normal. An analysis of volume in this situation would help traders identify these movements of prices.

High volume during major market movements
2. High volume with little price movement
This is another pattern that usually shows in the market when there is professional distribution going on. This action means that even though there is buying pressure from weak or hedging traders, there are professional traders selling, and thus they keep the price in a tight range. Many great bull markets in history ended up with this kind of pattern, which is most reliable when the market is at new highs.

Narrow range and high volume means heavy supply (gold futures weekly chart)
3. Confirmation of a price movement
A rising market usually sees rising volume. Higher volume is a sign that the trend is healthy and likely to continue. Increasing price and decreasing volume shows a lack of interest and may warn a potential reversal. Traders may use this information to decide if they are going to open a position during an uptrend or if they prefer to wait given the low levels of volume.
Strong volume confirms a successful breakout. If the breakout occurs under high volume, this is a confirmation that traders are bullish/bearish and the price movement is likely to continue. If the breakout happens under low volume, this may signal a lack of interest and a higher probability of being a false breakout. Before opening a position, traders should look to volumes to understand if the breakout will be successful or if the buying/selling pressure is not strong enough.

Successful breakout confirmed by high volume
Useful Indicators
Price By Volume
Trade volumes appear at the bottom of the chart. However, Price By Volume (PBV), also called Market Profile, is an indicator plotted on the vertical axis. The indicator shows how much is the trading volume in a certain price range. This information helps traders understanding where are the major congestion zones, as well as resistances/supports. This indicator is mostly useful in very short-term time frames, such as 1 minute. We already wrote an explanative article about this indicator, which you can read here.
The chart below shows the price ranges with higher volume. Traders should expect some resistance/support or congestion areas near these levels.

Market Profile
You can download this indicator here.
Go Further with VSA
These are only some well-known indicators used in volume trading. However, they do not give you important information like if there’s buying or selling pressure. By looking only at these indicators, you only have an idea of generic levels to pay attention to. A complete volume spread analysis implies looking at demand/supply patterns, to identify the best time to buy and sell. By knowing if there are many traders selling/buying, you can anticipate important price movements.
The Bottom Line
Volume is a powerful tool to analyze the market and predict where prices are likely to go. Traders should use volumes to see what large traders are doing and follow their lead since that usually is where the money goes. However, volume only provides insights and traders should not use it right away as trade signals. Prices ultimately confirm what volumes already said and vice-versa. Traders should always wait for a price/volume confirmation and only then open positions.

