
The analysis on the major pairs made yesterday, 20th June, can be seen on investing.com, here: http://www.investing.com/analysis/analysis-to-the-major-pairs-200137132. This post below is an update on that analysis.
EURUSD
Since yesterday, EURUSD went further down and closed the gap, after a rally attempt on low volumes, relative to the Tokyo’s session. I maintain my view that a test/low volume bars on this area, and on prices closer to the trendline, will provide an opportunity to go long.

GBPUSD
This pair has been stalling on the breakout’s price, and showed supply in the form of an upthrust – it’s a bar making a higher high than the previous ones, shaking-out longs from the market. I doubt that selling will have a prolonged effect on the market however, and a correction of this extended move may still give an opportunity to go long.

USDJPY
Out of the 4 pairs, this is the one with the most interesting development in my opinion. The trendline is now being broken, but the volumes are very low, which show lack of demand. After such demand before, I would expect more buying for a true up movement to happen. If the volumes pick up on this area, or more VSA signals appear, I expect USDJPY to start a more significant up movement.

USDCHF
This pair is on the lower part of the congestion area. The last bar was a test – its low was close to the congestion’s lows, and yet, selling didn’t pick up; it closed on the highs, with a low volume. Just as I’m writing this post, the prices are struggling to rally after this supposedly strong indication, which shows there is no particular interest in an up move for now (we call it a failed test).

NZDUSD broke out an old high at 0.705 last week. Since then, it has been showing weak action seen by the stalling prices and high volume, and today, a low volume rally to the breakout’s price. Until something changes, I’m assuming the smart money isn’t interested in higher prices given the past action. FOMC is making a press conference today at 6pm GMT, and tomorrow at 12:30am GMT, US Unemployment claims and CPI reports are being released. Between the two, there might be an opportunity to trade NZDUSD on a small timeframe, such as M15, especially if FOMC press conference is bearish for the Dollar, which would make the prices more attractive to short.

AUD Update
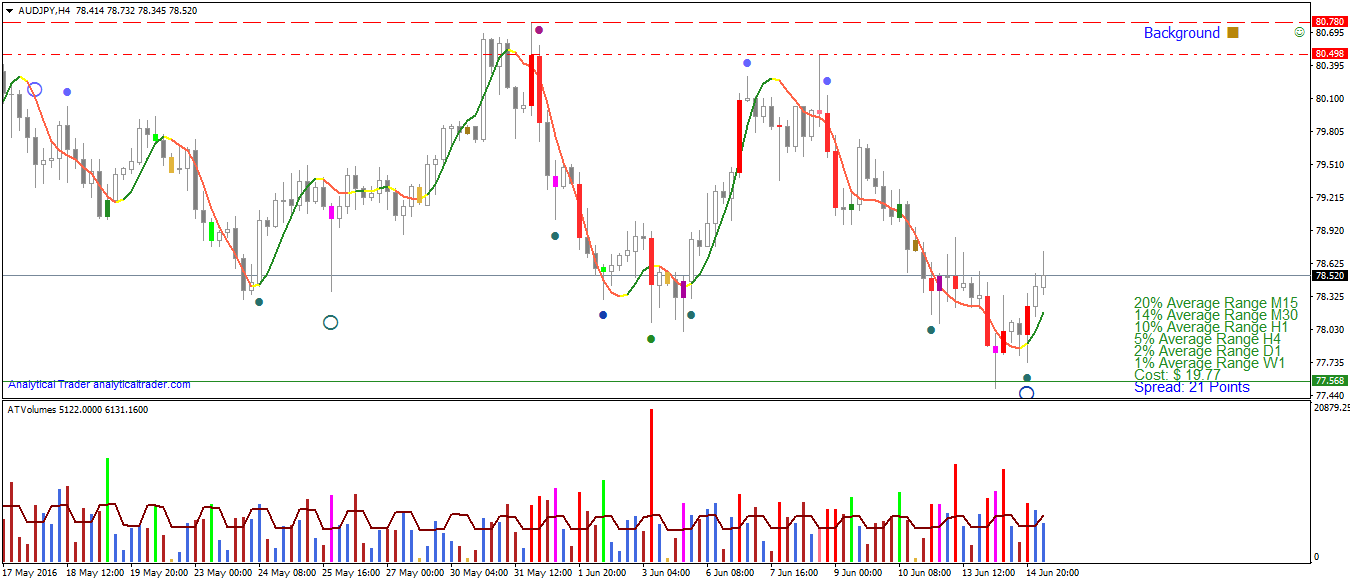
In the last post, I analyzed AUDUSD and AUDJPY. In AUDUSD I noted that a correction would be necessary after such a movement, and would provide a buying opportunity. It showed up last night at midnight GMT in H4. More opportunities might show up today if there is a reaction to the downside. AUDJPY bounced off a previous low on high volume, meaning there was a shake-out in the market (stop hunting). Likewise, a down reaction can provide another buying opportunity.

AUD Pairs are undergoing a correction for the past few days. Boosted by FOMC on the past Friday, AUD/USD broke the down trendline that was in place since April, on furious volume, which is often a good indication of strength in critical areas. Reaching higher ground, the volumes showed some supply – first a churn (narrow range bar with high volume) and an upthrust (bar to trigger more buying and short stop-losses). After such a strong movement, a correction is the market taking a breath, and it can provide more trading opportunities. This correction has given yet no signs of stopping, and I expect a resistance to be found near the break-out’s bar, where many large traders went in on the market, which is where I’ll be looking for a price reversal.

AUD/JPY
This pairs looks more interesting than AUD/USD to trade on the short-term. Last week there was a shake-out of the 78.43 support, which likely triggered many stop-losses and sell-stops, that provided liquidity for institutional traders to buy it, and reverse the prices. The buying is there, but are there still many sellers at these prices? To know that, we have to pay attention to the volumes and price ranges – narrow ranged bars or low volume ones would show that the reaction is going to stop, and that we’ll see higher prices.

EURUSD Daily

After the negative numbers on NFP last Friday, EURUSD fired up on massive volume, and is now getting to the point of previous distribution. A lower timeframe will show the recent picture more clearly.
EURUSD H4

On H4 we see that there is some supply at this price level, but with the massive buying on NFP that took place, I expect major players to be still supporting an up move, until they can sell more of their positions – there is still room on the upside to go.
The Pound went through a sell-off in the last days, after testing a resistance at 1.471. The volumes showed supply through May when attempting to rally to the 1.4700 area, but the prices held on below it, with only minor shake-out attempts. Even though there was an up trendline, which shows the long-term trend, a trend can always change, and that’s usually the case when there is professional selling over an extended period of time.
The trade was taken on early London session on the reaction rally, where more sluggish action was seen, and the take-profit set above the nearby trendline.

Resistance Fake Breakthrough
This video is one more of the series of videos about VSA, and shows the general setup on how to trade with supports/resistances and VSA, with the integrated alerts in the software. It’s posted in Youtube, if you wish you can subscribe to our channel to get notified of new videos.

