
On the weekends, the markets are closed and nobody trades right? Right, unless it’s bitcoins! It’s traded 24/7 on various online exchanges, such as poloniex.com or kraken.com.
So, how does BTC/USD (bitcoin versus US dollar) look like? On the daily timeframe, the rally from $440 was stopped on heavy distribution, reaching nearly $779 per Bitcoin on its peak. A downtrend ensued, and what caught my attention, was the recent selling climax on a really high volume – a lot of big buy orders were executed here, which made the wide bar close off its lows, and the volume fire up. The market was sustained right after, and it’s now breaking the high of a no supply yesterday.
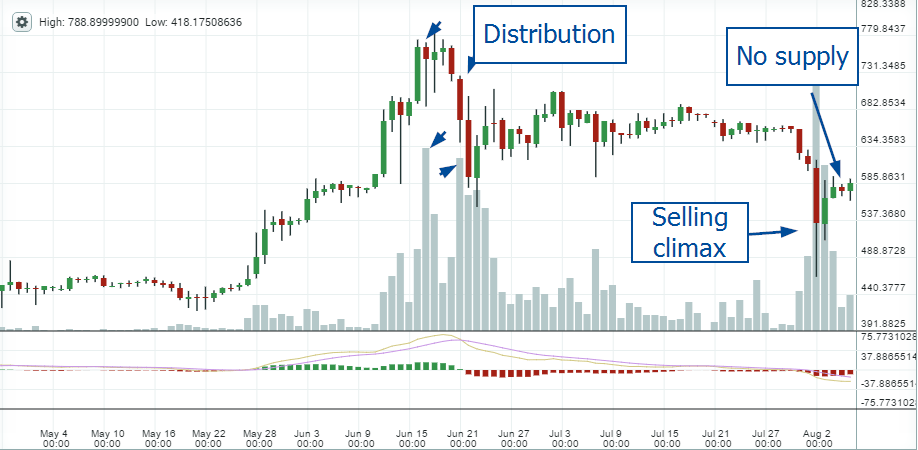
Bitcoin Market Analysis
An advantage of trading bitcoins, is that you also get access DOM (depth of market), or order book, usually only accessible in standard financial markets by paying a hefty sum every month. Here we see that lower prices have buy orders in a much higher volume than higher prices have sell orders:
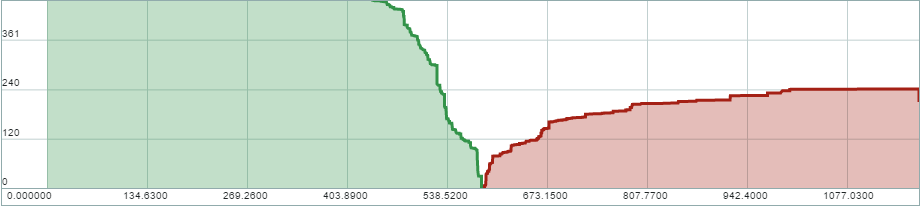
Bitcoin Depth of Market
This is more bullish evidence to me, at least on the daily timeframe, where this selling climax, and order book imbalance, will have more meaning.
Dynamic trend: Turned down
Background: W1 – weak; D1 – weak
Phase: Mark up

EURUSD H1 Breakout
In point 1 there two breakout bars, with high volume. The second bar had very high volume, which usually means there is some supply behind.
In point 2 was a series of down – bars with low volume, including a test. The up-bar with very high volume in point 1 with upthrust are very significant signs of weakness. But the weakness was not confirmed due to the appearance of the test shortly after.
In point 3 there were two up bars with high volume, which is a normal trend continuation.
Suggested Strategies
The market is still bullish, with a strong background. Wait for a strong VSA signal.
Dynamic trend: Down
Background: W1 – weak; D1 – weak
Phase: The market is downtrending after significant distribution on the last top (mark down)

USDJPY Downtrend after Major Selling (distribution)
In point 1 there was an Up‐thrust with very high volume (climax). The next bar was a down bar with high volume, which confirmed selling (weakness) in point 1. VSA showed major supply on timeframe H1 and H4. An upthrust is a bar that makes a higher high than the previous ones, but closes on the lows or mid of the range; it’s a supply bar, usually appearing on fake-breakouts or stop hunting.
In point 2 there was another Up‐thrust again, which showed overall weakness. Also, the volume in point 2 was much lower the volume in point 1, which means the supply in point 1 has overcame demand.
Note: due to obvious weaknesses of background in the area 2.1, it’s recommended to switch to the M15 timeframe to search for “No demand” as the potential point of entry. Often these appear with a good risk:reward ratio (1:4 or more)
In point 3 there was another Up‐thrust with very high volume.
In point 4 there was No Demand. It confirmed overall weakness.
Suggested Strategies
Consider going short when the price gets back to 103.50 area, and VSA produces No Demand signal (those would be low volume up bars). This is an area of previous weakness, and a round number, which means there will be retail traders to shakeout at that area.

